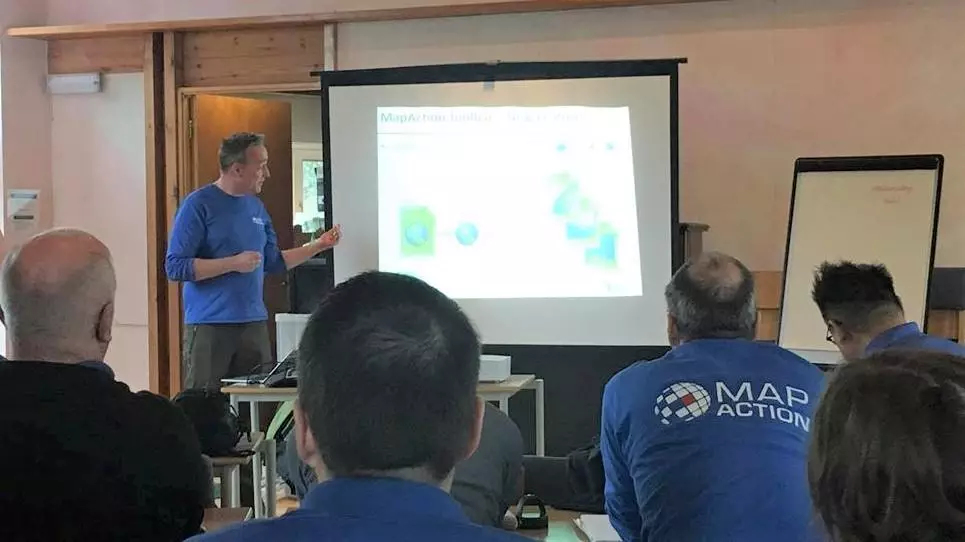
By Alan Mills, MapAction volunteer
Can satellite imagery and UAV data become useful data sources for humanitarian decision making in disaster relief coordination?
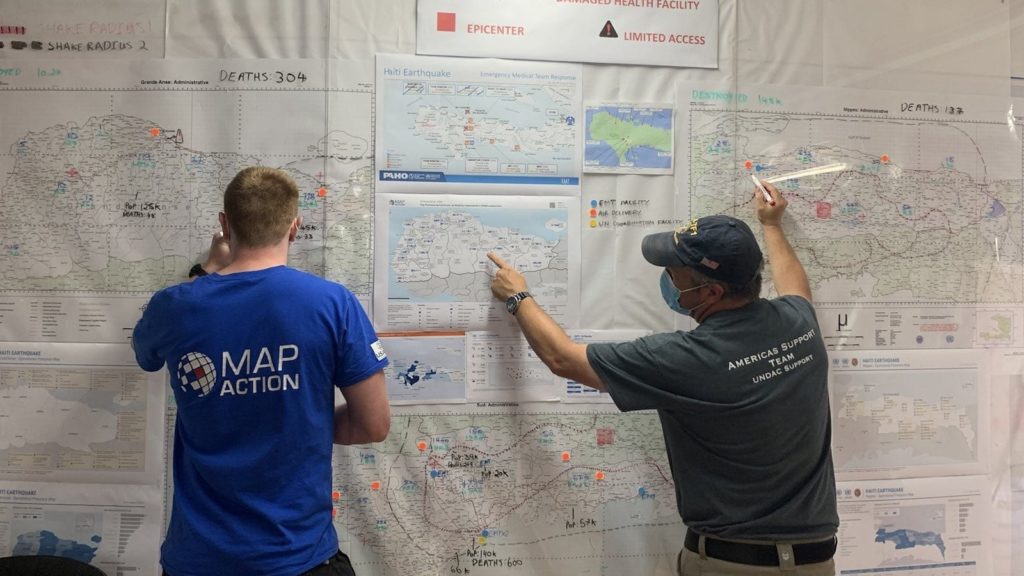
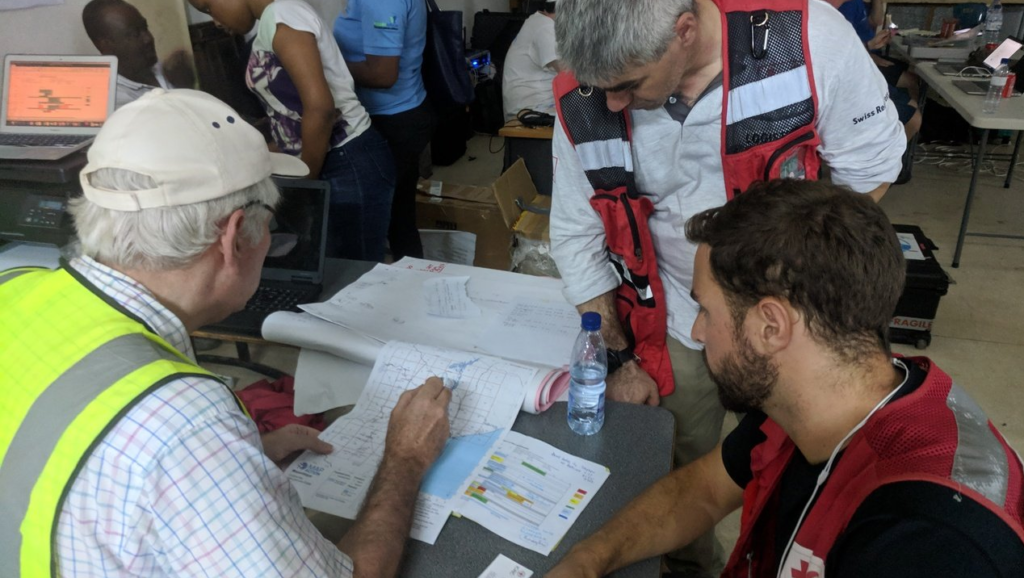
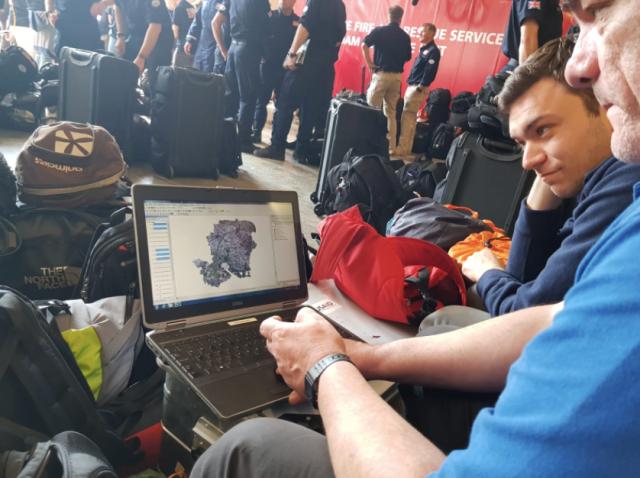
Satellite Imagery and data collected by unmanned aerial vehicles (UAVs) are increasingly promoted as valuable new information sources to aid humanitarian emergency decision making, but how much have things really changed? MapAction is at the forefront of information management delivery on the ground in humanitarian relief, and the choice of which data we use depends on what is best for how to get aid to affected people. Our primary aim is to inform decision making by mapping for people in a crisis, ensuring the best data is timely in delivery to help those affected. Do satellite imagery or data from unmanned aerial vehicles or UAVs make a difference in the field yet? We consider the evidence from our perspective.
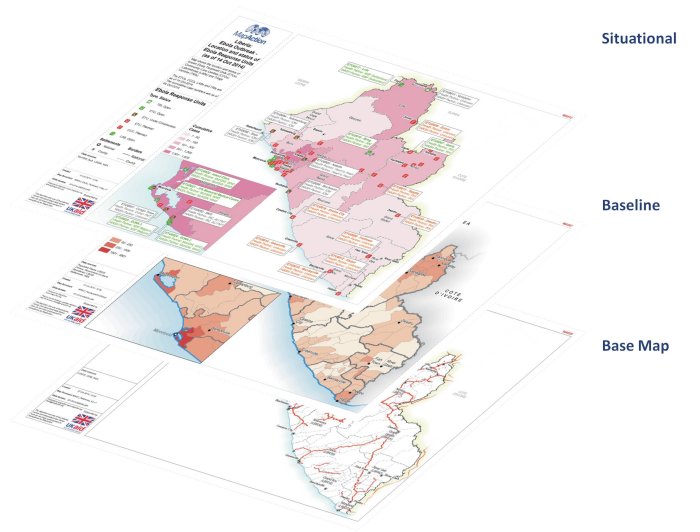
People focus is primary in MapAction’s approach – we source the optimal data available to help people, focused around what they need. We don’t use or process data just because we have it in the hope that something good will come. There’s just too much data available to do that. As well as topographic map data, baseline statistics, situation reports and field data, imagery from satellite and unmanned aerial vehicles or UAV (often called drones) is regularly available and has been used in a wide range of emergencies, from cyclones and earthquakes, to migrant crises and munitions explosions. But we have to make decisions on which data to use.
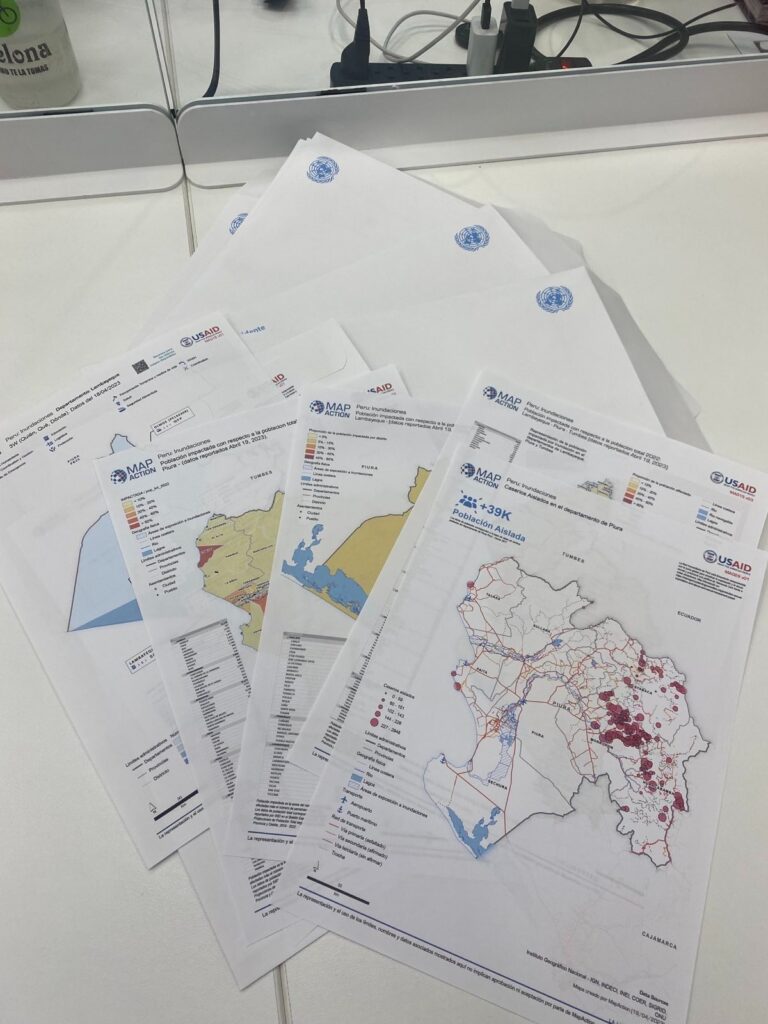
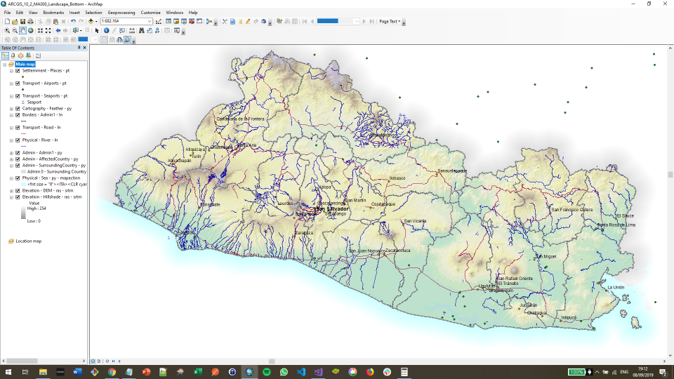
In a recent internal review calculating how much imagery has been used by MapAction in our emergency missions, some fascinating conclusions were drawn. First, we make more use of derived products than we do of original imagery. The most used dataset comes from the Shuttle Radar Topography Mission (SRTM) data flown way back in 2000. Where other elevation data are not available, the SRTM’s digital elevation model data forms a pleasing and useful backdrop to so many maps. It helps responders get a feel for the topography of the disaster affected area and in some cases assists in logistics planning, market analysis and winterisation predictions. SRTM is also easily accessible and can be downloaded to laptops before a deployment starts. Its old, but simple and effective.
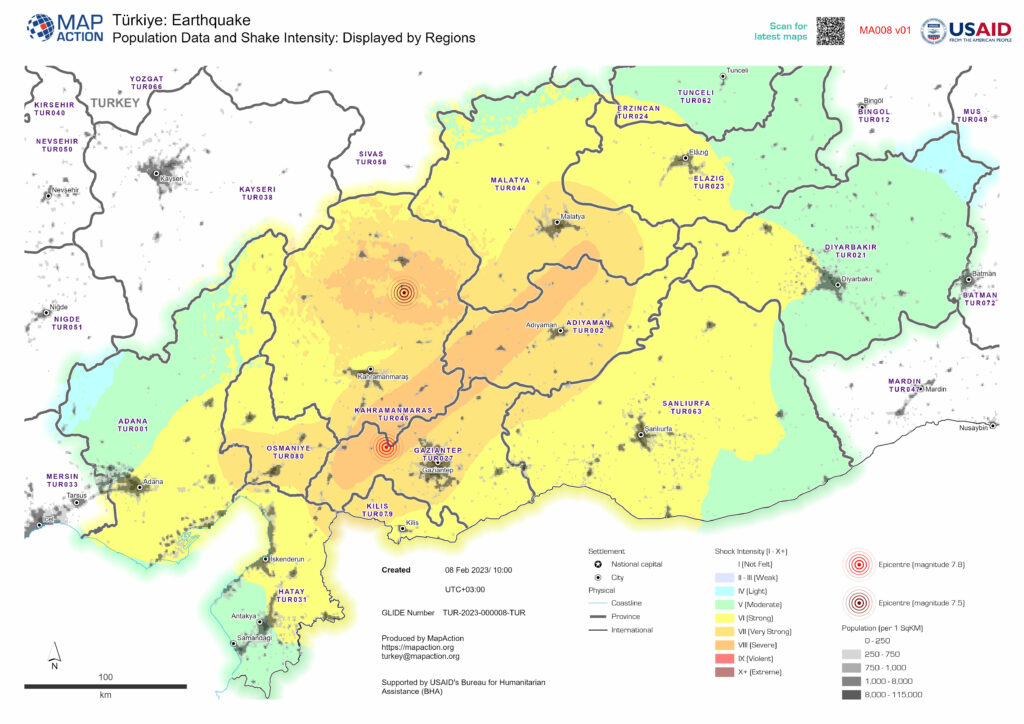
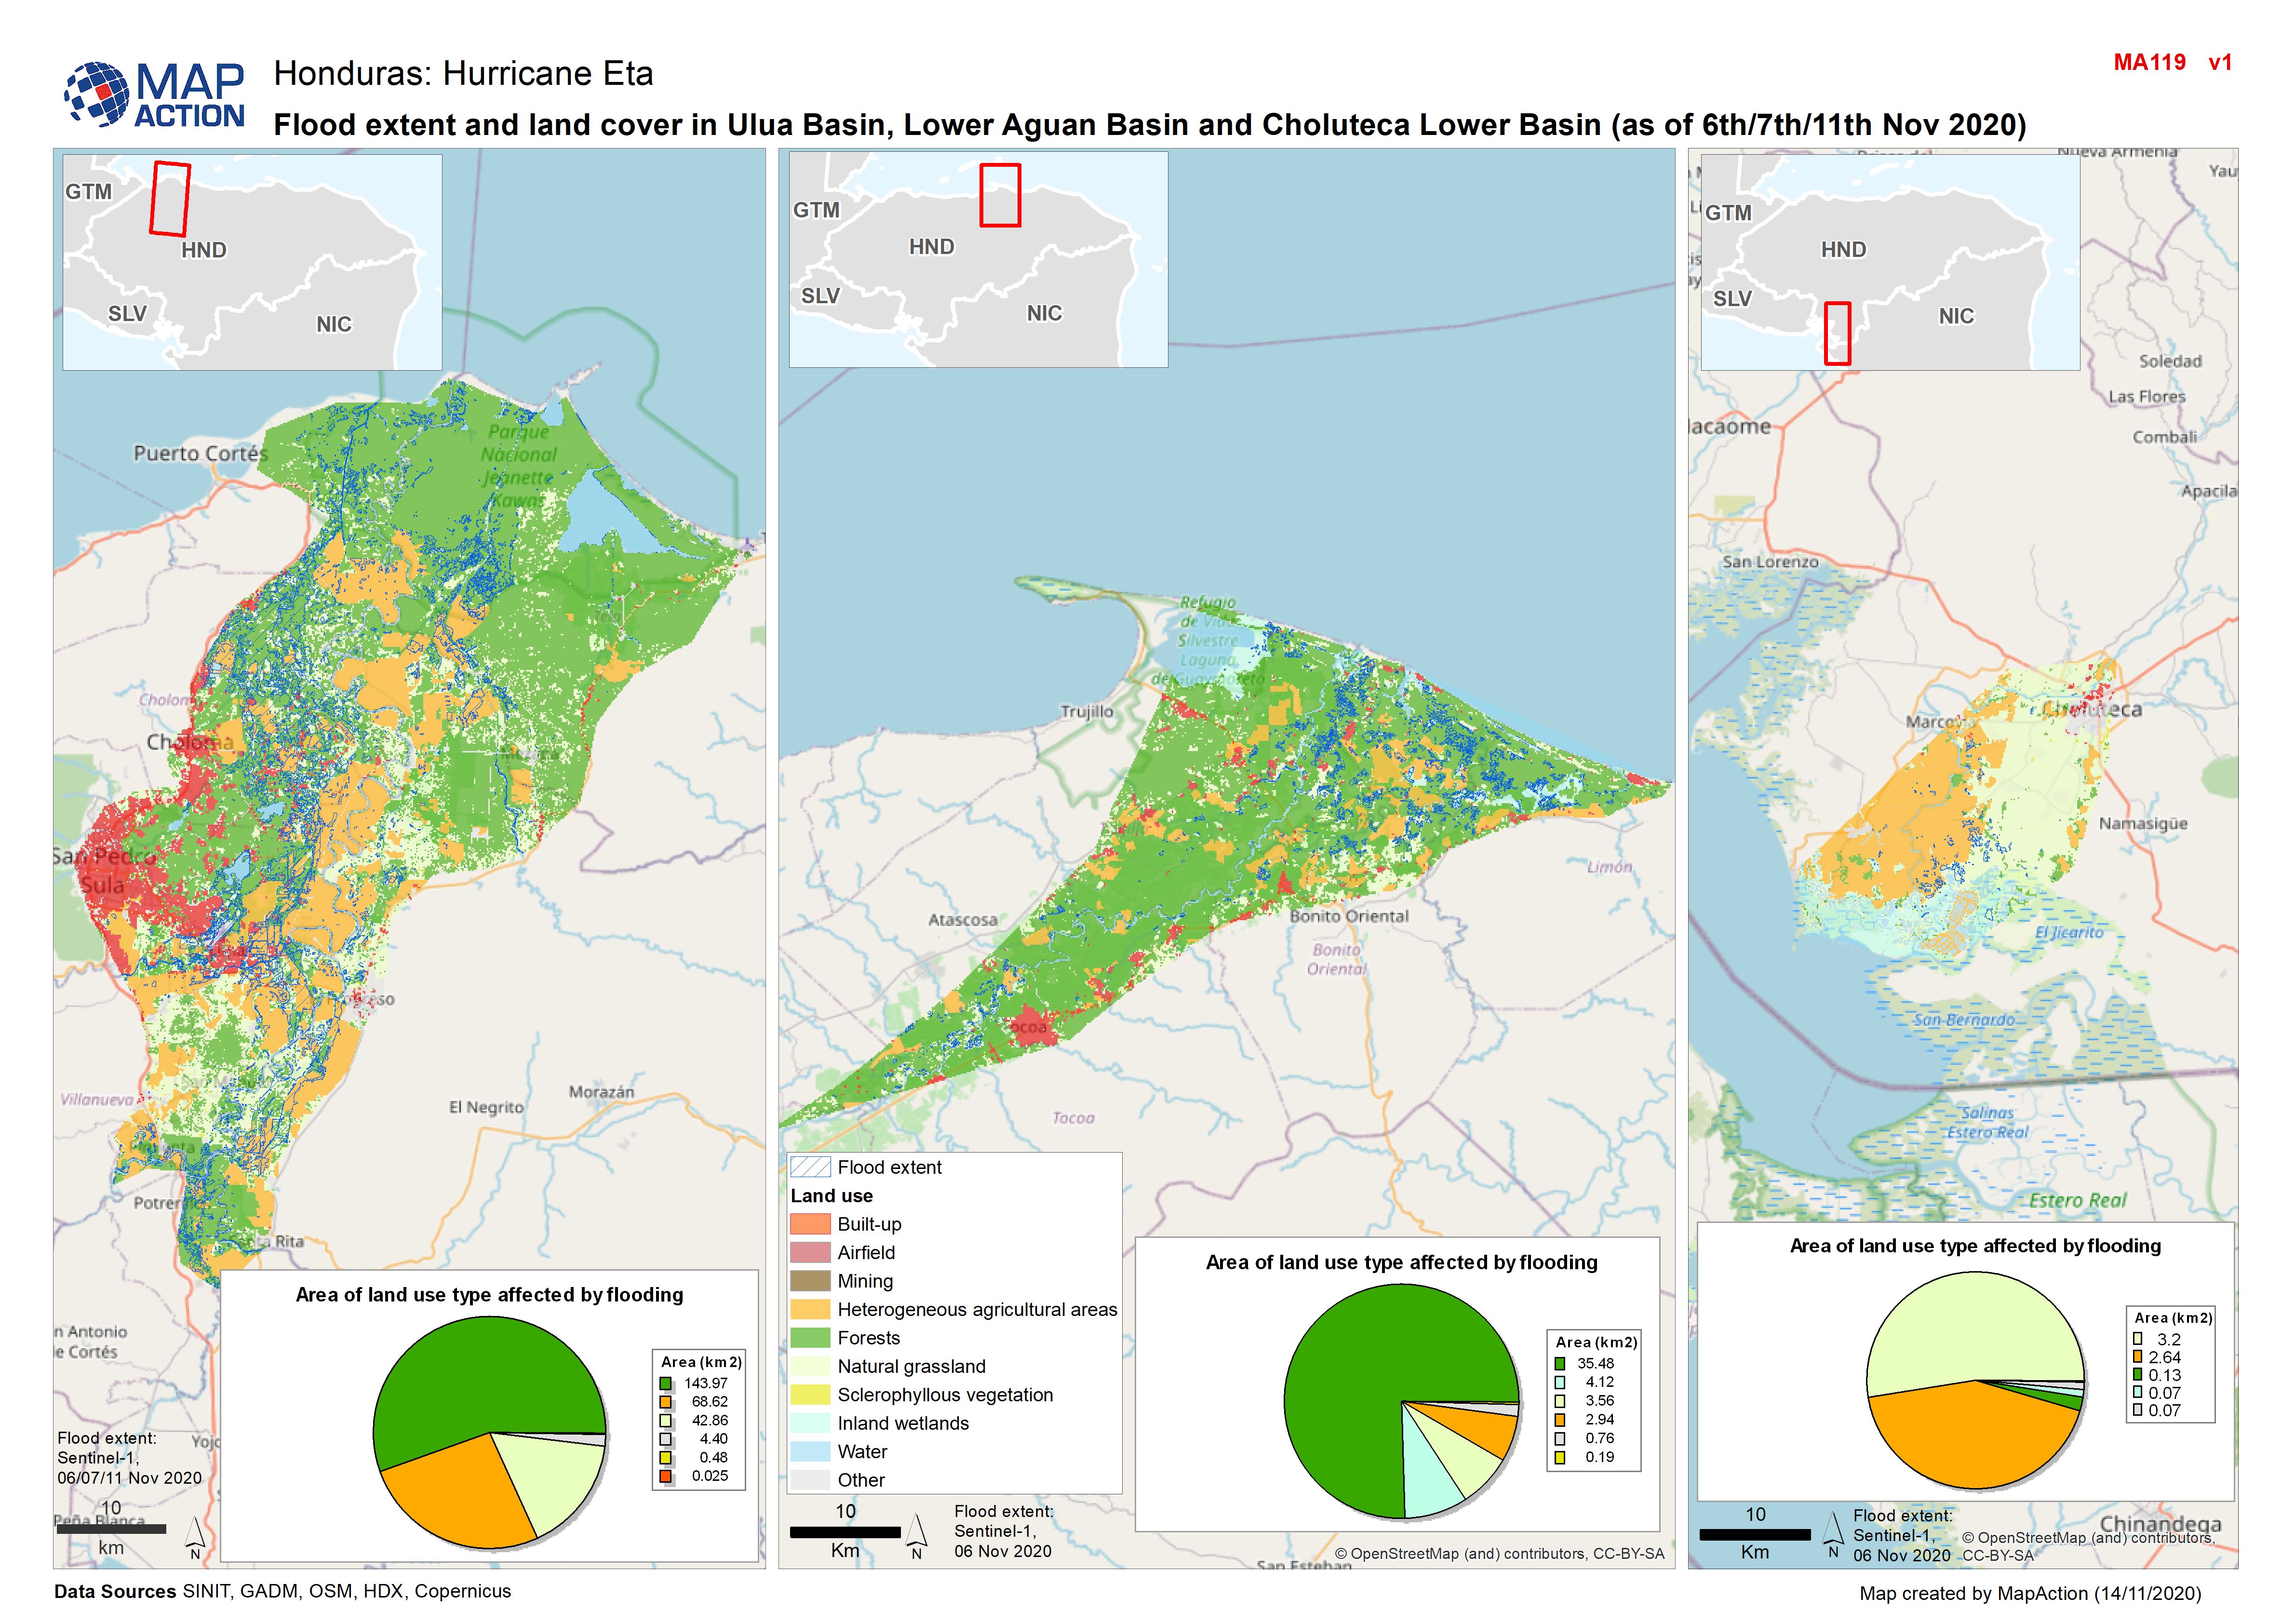
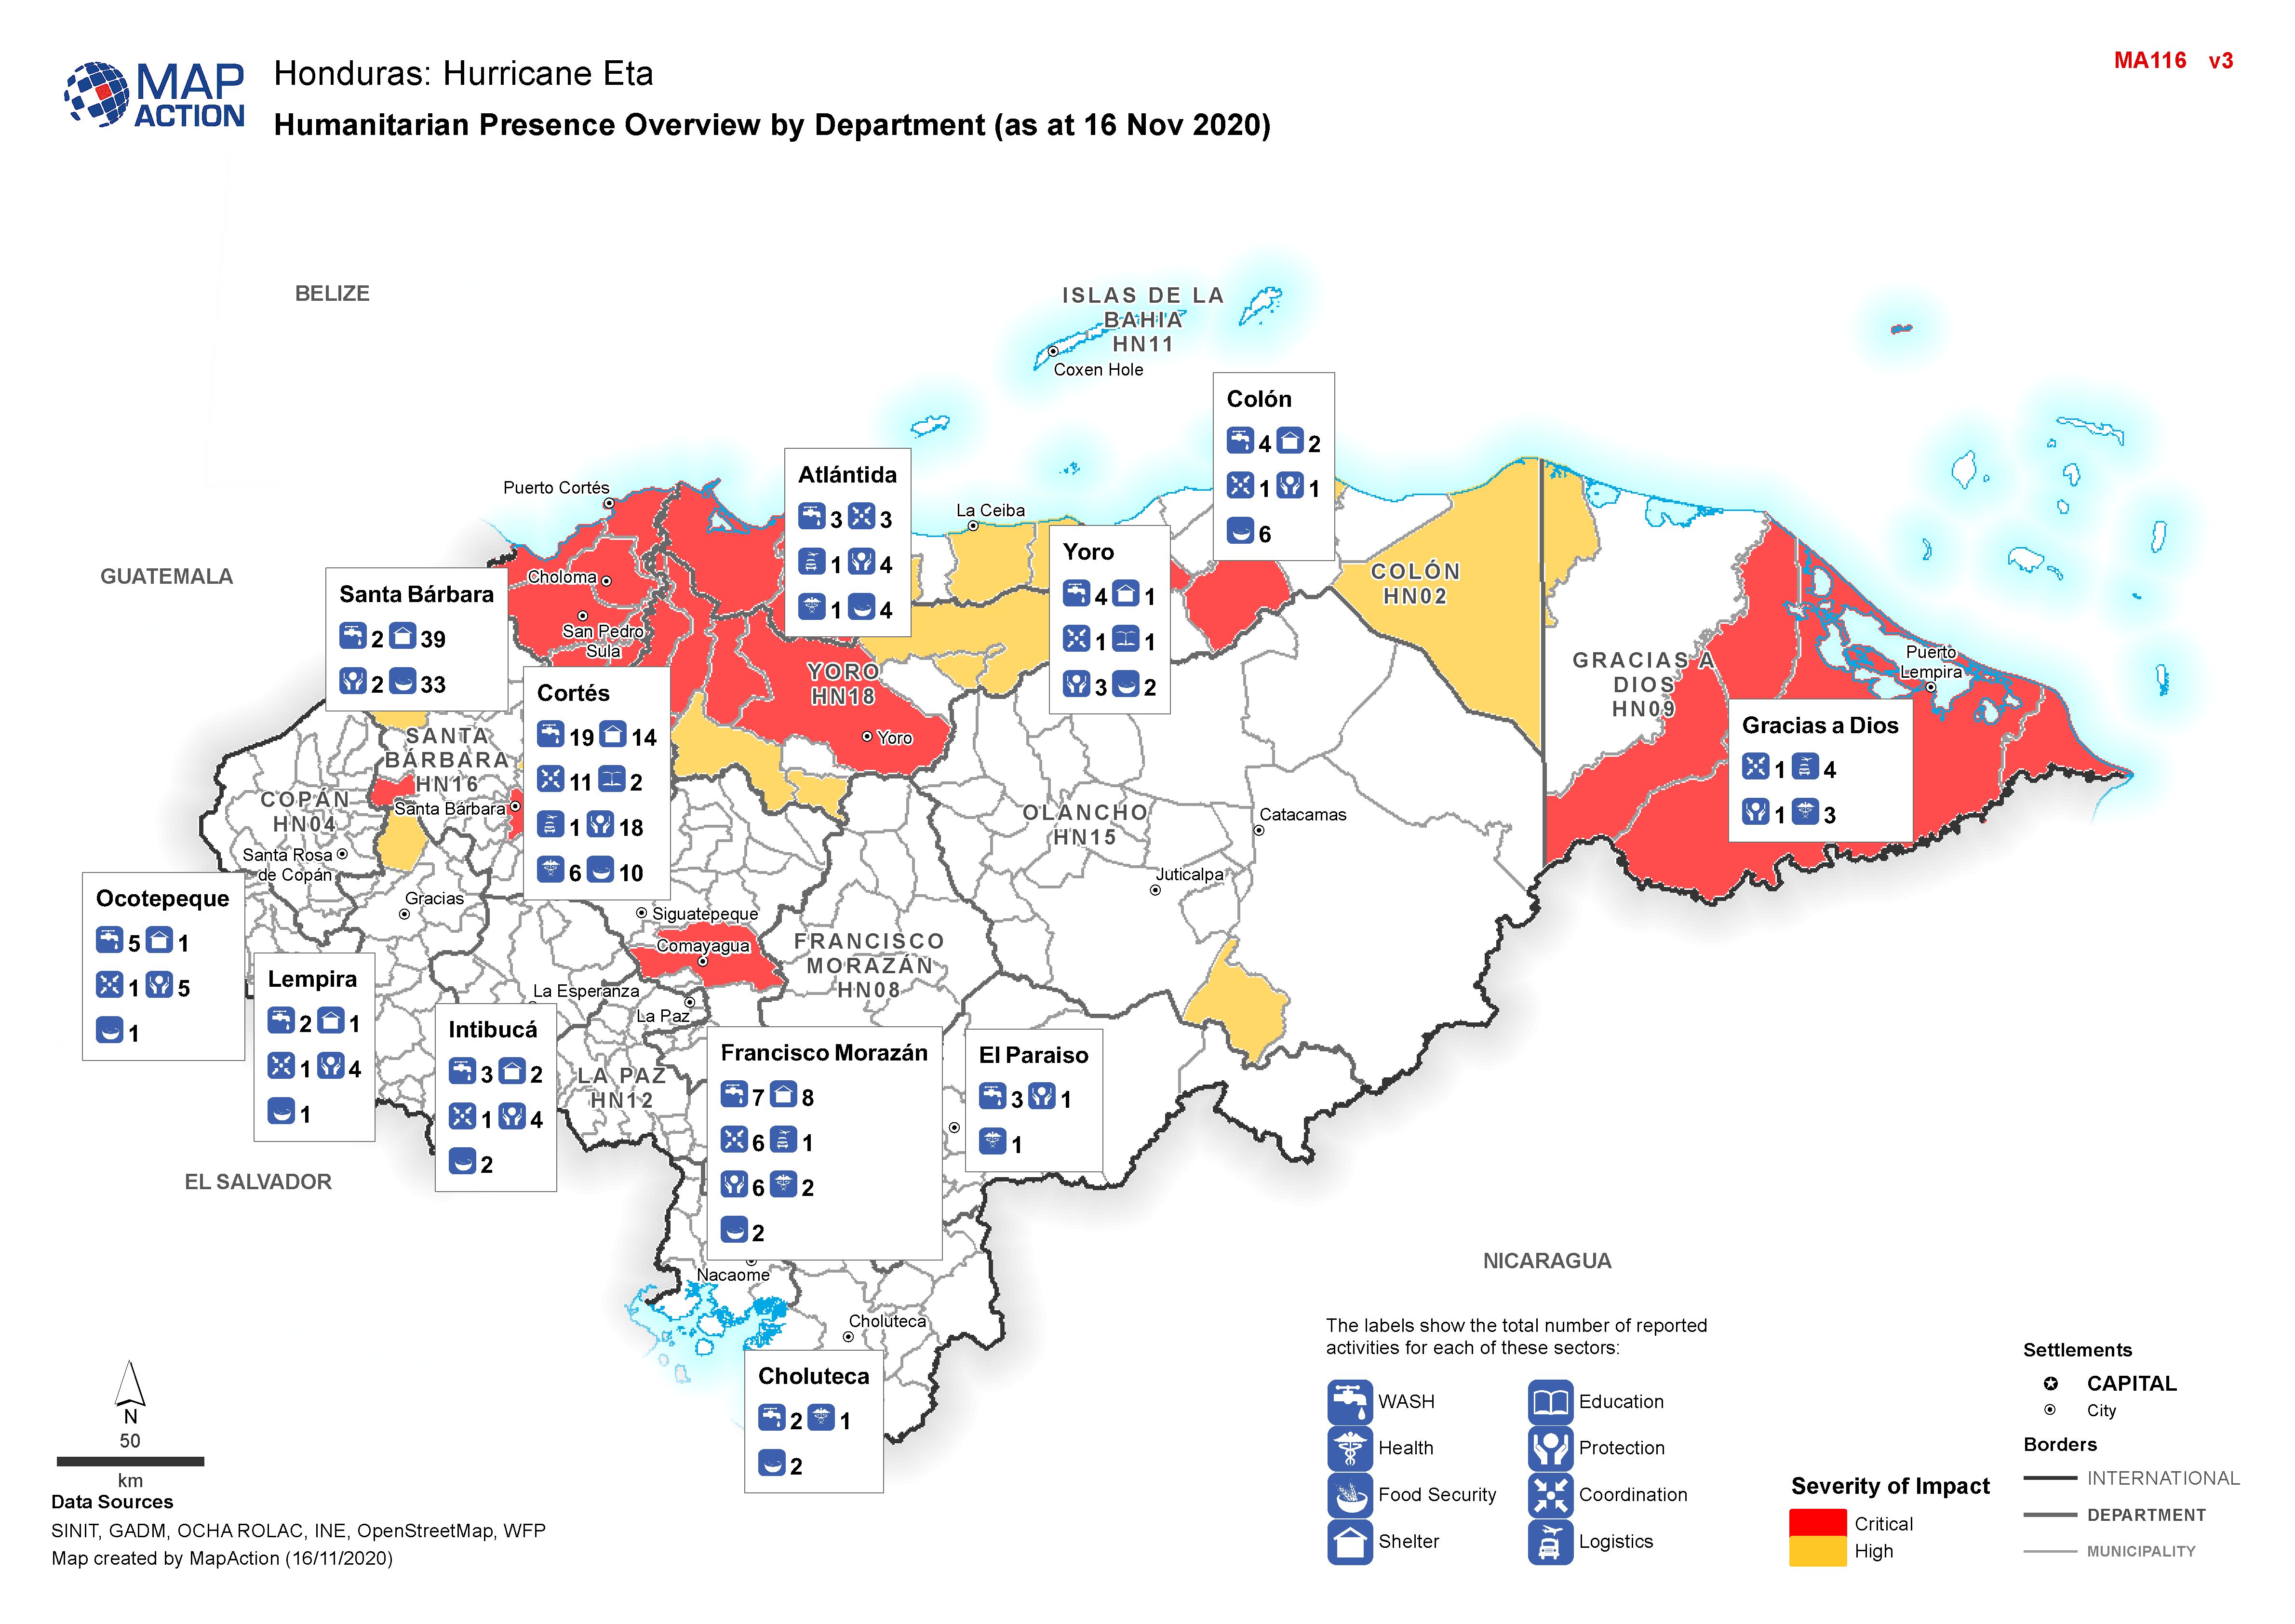
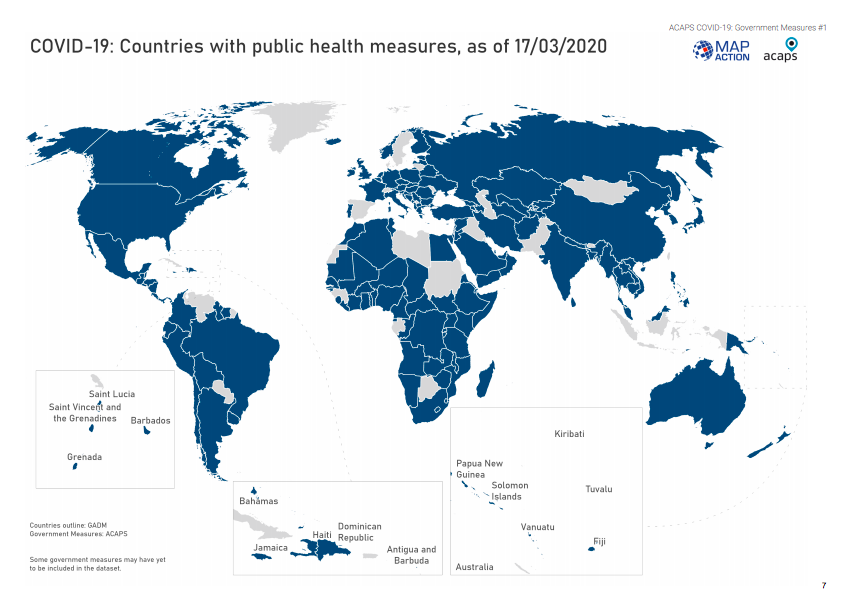
Also frequently used are flood extent derivations (primarily from NASA’s Moderate Resolution Image Spectroradiometer – MODIS) and rainfall accumulation models from various sources showing the intensity and longevity of rain in affected areas. MapAction frequently accesses data from other agencies (for example UNOSAT) who have detected damage from imagery, such as after a cyclone or earthquake. Some more moderate use of land cover data or wildfire detection has also been exploited.
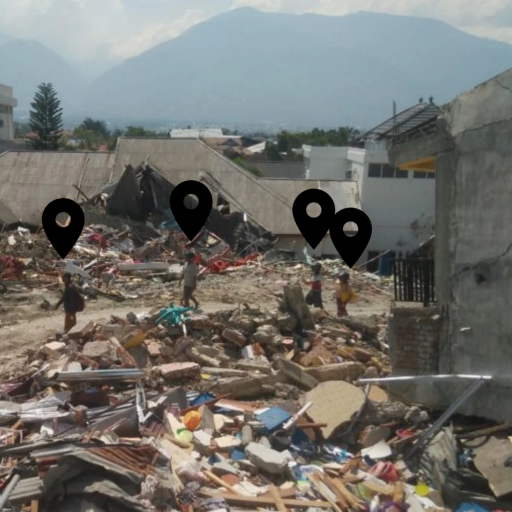
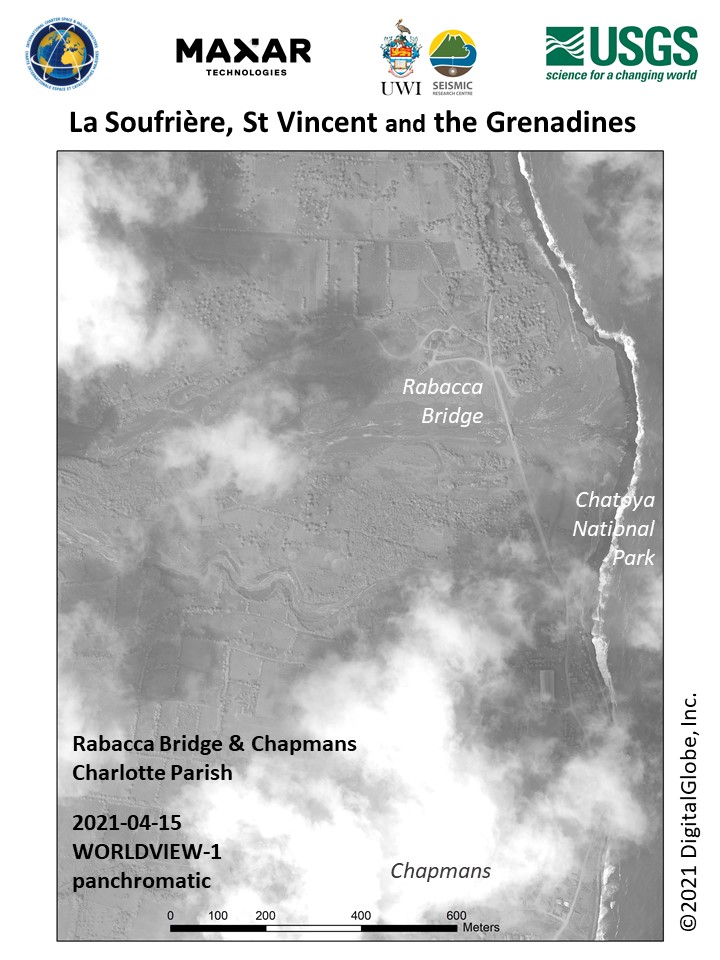
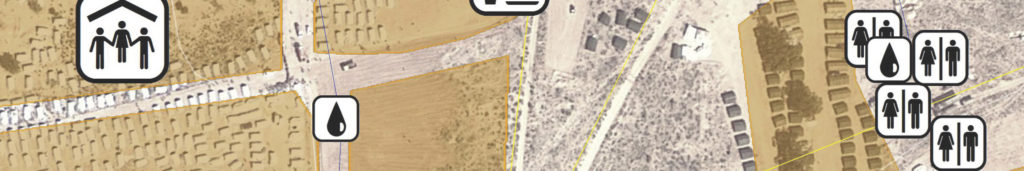
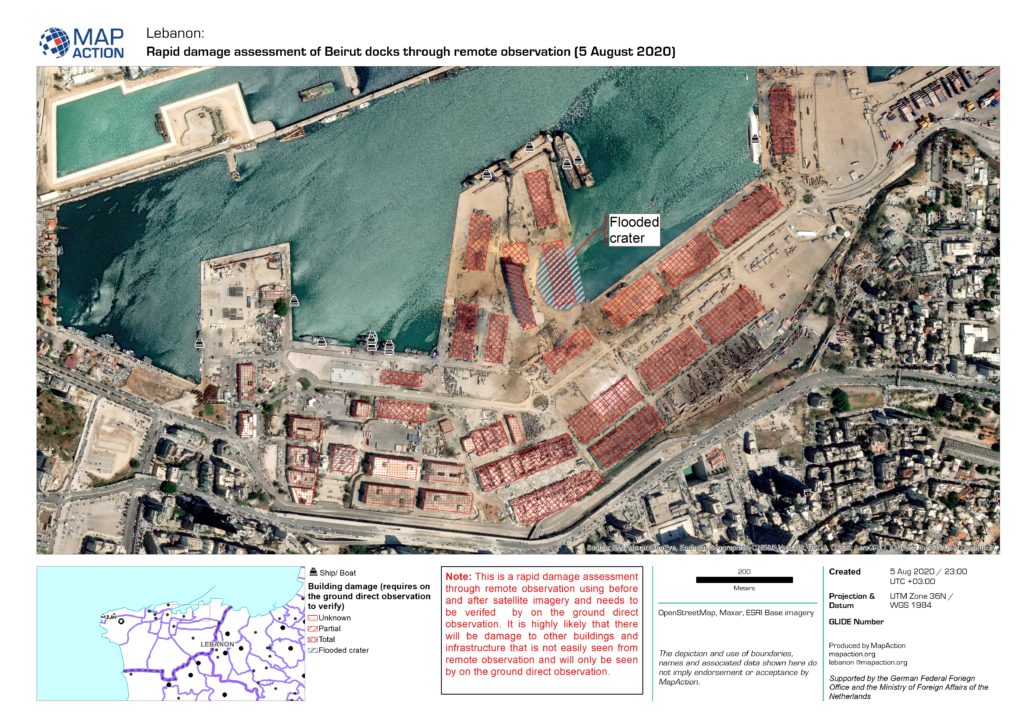
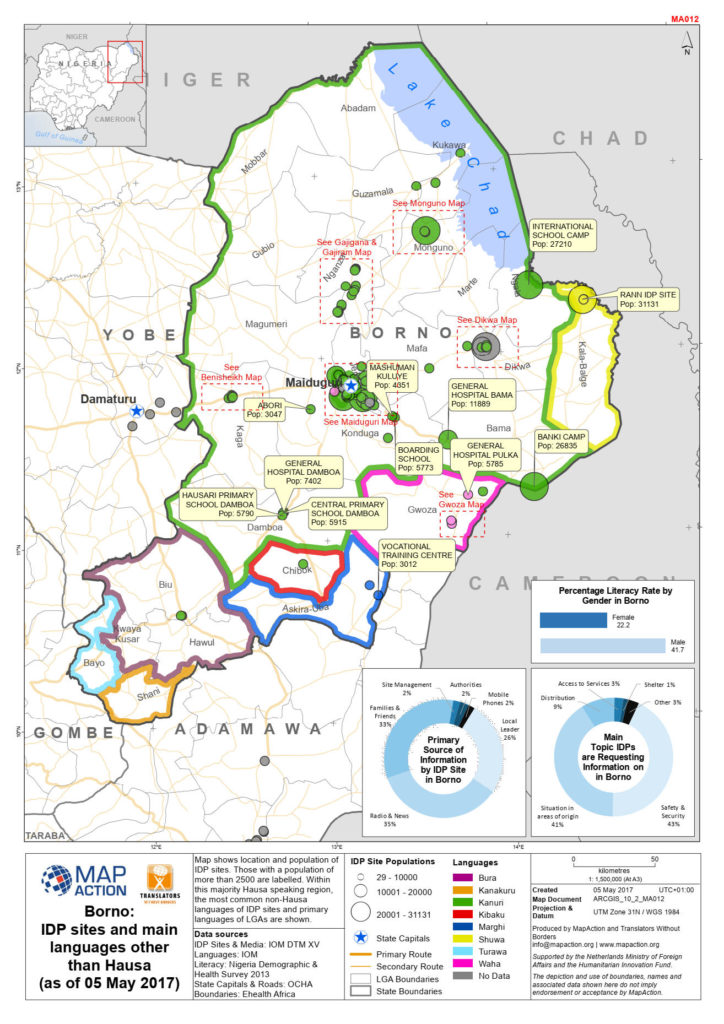
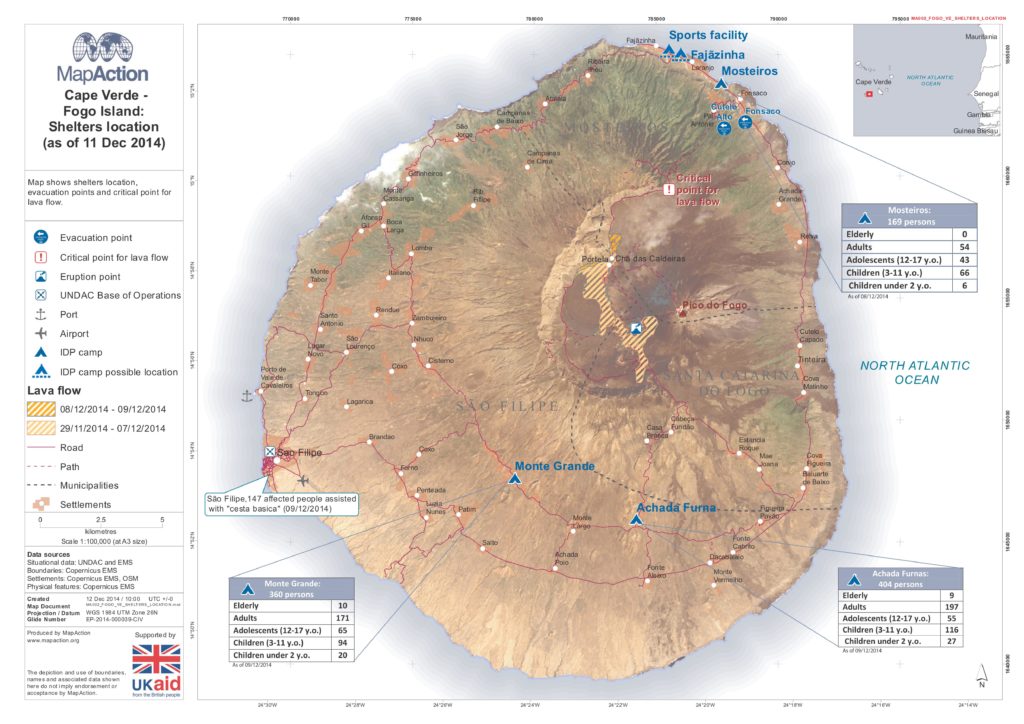
Our use of basic visible spectrum imagery has usually been restricted to small areas of interest, as a detailed backdrop against other data (such as in refugee camps) or to highlight conditions before and after a disaster. To date we have not made use of UAV imagery in any of our published maps.
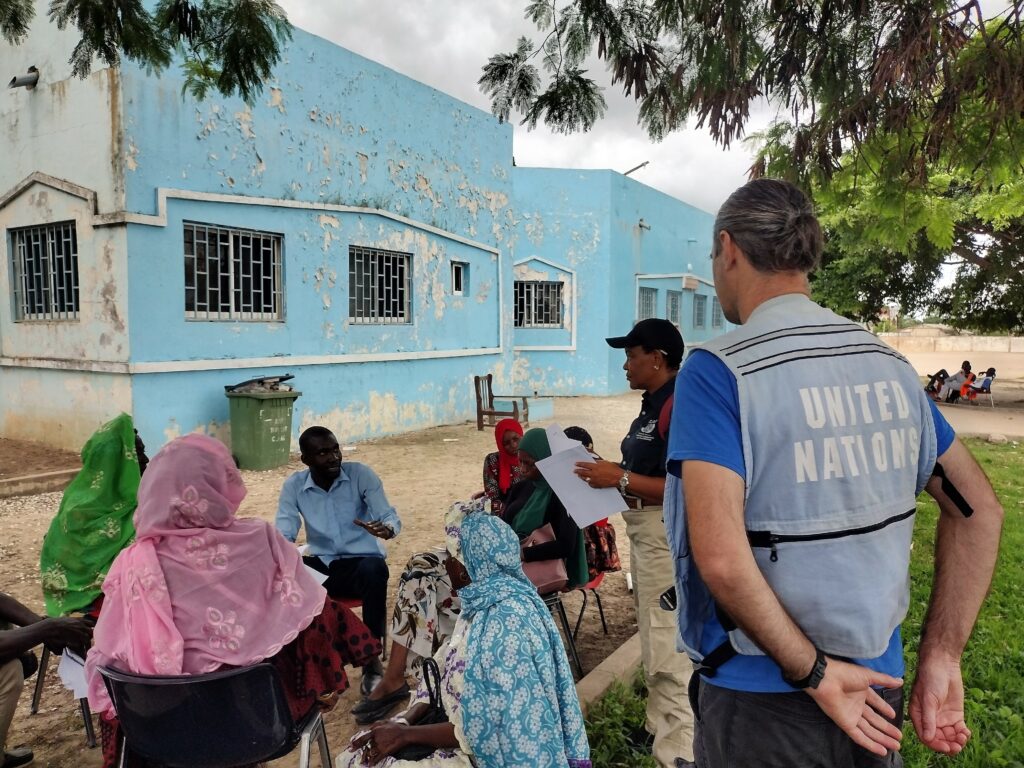
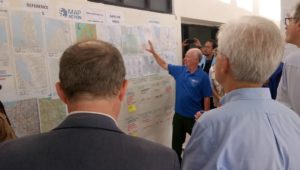
What does this tell us about the use of imagery in the kinds of emergencies MapAction responds to? First it is worth noting the environments in which we often work. We are usually based in the countries where the relief operations are focused, and where ‘normal’ Information Management working conditions do not operate, due to power and IT Comms challenges. We cannot necessarily download large volumes of data due to thin or interrupted internet connections. We have very little time to stitch lots of imagery together, process that raw imagery, or analyse the bands of data into something meaningful. And we are bombarded by multiple requests to process data for a range of relief managers in a rapidly evolving situation, so we work under acute time and technological constraints.
Raw imagery that is bulky, and needs processing and analysing is not best suited to these conditions even if it is handed over on a very large capacity USB stick! Smaller vector based datasets derived from the imagery, or raster data ready-to-travel pre-disaster are much more serviceable.
A further problem with visible spectrum satellite imagery is that it is not appropriate to post disaster scenarios in especially tropical or temperate climates. Cloud or smoke frequently cover the area of interest. Imagery may only be acquired well after its primary purpose was needed and the relief effort has already moved on to a new phase. In certain scenarios remote interpretation can also misclassify the data and without extensive ground verification can at best confuse, at worst mislead the decision making processes on the ground.
UAV claims to solve some of these limitations. The spectrum of UAV technologies emerging in disaster management purport to give timely information and services, including carrying essential medical supplies, surveillance in areas difficult or dangerous to reach by human assessors, capturing data below clouds which obscure the ground from satellites, and mapping damage.
Digging below the hyperbole and excitement which often surrounds a new technology, the reality has been that while the videography has an immediate visual impact and is being widely shown both in the formal and social media, the actual usefulness for information management in the humanitarian relief effort remains to be proved. Current limitations on the technology, whether the lack of flying time by lightweight UAVs, the difficulty in logistics of getting larger vehicles to the affected areas, and for getting permission to fly UAVs in the same zones as helicopters and planes on other relief operations is also hampering effectiveness. UAV operators are learning rapidly that in responses where normality has broken down simple resources such as transport and fuel, let alone material to put together flight plans, can be difficult to obtain and greatly restrict the ability to mobilise.
Case studies for UAVs in the humanitarian sector do exist, but they are more often in disaster preparedness, mitigation and resilience. There are precious few documented examples of UAVs providing useful information to be reliably included in disaster assessment, relief delivery or coordination.
As well as the logistical problems which need to be overcome, an understanding of what humanitarians do, or need, on the ground is too often lacking by enthusiastic UAV advocates. Admittedly this is an omission in many areas of technology being offered to relief operations. As Nick van Praag said in a recent blogs “Absent a clear direction, labs tend to focus on innovation by gadget”.
Humanitarians are not blameless in being slow to explore new solutions, technology or processes, but there is obviously a need for a more open and two-way dialogue to target both the space and UAV sectors’ undoubted talents, resources and goodwill towards humanitarian relief. Humanitarians must be open to testing entrepreneurship and innovation but technicians must listen to the hard-learnt experience of humanitarians in dealing with the complexity, even chaos, desperation and rapidly evolving ground situations in disaster affected locations.
Two encouraging trends suggest a growing maturity in the UAV sector that might soon deliver game-changing information to humanitarians, and make a difference to the suffering of those affected by disasters. One is self-organisation, leading to regulation and cooperation. A single UAV operator testing their kit in the field is not going to help a suffering population. However an array of UAV operators who have resolved key issues in advance will get much attention and praise. Before flying, they will have agreed on issues such as; how to carve up the affected area, which sections to map first, standards of operation, output resolution, how to stitch that data together and extract useful information about damage, logistical bottlenecks, flooded areas, tornado paths, critical infrastructure status, etc., and how to provide that data to humanitarians when they need it.
The emergence of UAViators also gives encouragement. Not only are they sharing best practice and actively seeking ways to coordinate their resources in the field, they are also grappling with the multiple legislative issues in many countries to get permission to fly, avoid hampering any other humanitarian actions and developing a code of conduct for UAV operators on the ground. Potentially they are a one stop shop for humanitarians wanting to find advice on how best to engage with the UAV sector.
Further causes for optimism are targeted improvements to the technology that relieve the logistical bottlenecks in the environment in which UAVs have to work during and after disasters. Better geo-location services routinely found on board UAV platforms, faster and more accurate automated geo-correction processes, longer flight and shorter recharge times, recharging in the field, better broadband (for example from new global satellite arrays), better resolutions, and higher specifications for the lightweight end of the UAV spectrum will all contribute to more effective operations.
Localisation of UAV operations in areas prone to disasters either by national operators or international organisations prepositioning their kit in the right places is also occurring. This localisation, alongside working out legalities and permissions pre-disaster, should hasten deployment times and reduce costs to producing useful information.
A challenge could be set by humanitarian information management officers to give awards – or at least a friendly pat on the back – to those UAV operators who can deliver a seamless, interpreted and compact set of data (e.g. damage assessment) over an affected area – not just where the UAV can fly – when the humanitarians need it (e.g. initial assessments within 72 hours of the disaster occurring) at an effective scale (we may need to see buildings but don’t need to count every dislodged brick).
Even where the above parameters and technical challenges can be met, donors and users should still weigh up the cost-effectiveness of UAV operators in the field gathering huge amounts of data which might be more easily, more cheaply and less disruptively gathered by other sources like satellite or ground surveys. Just because you can gather data at very high resolution and in glorious technicolor with a brand new device, does not mean you should.
Do we make too much fuss of UAVs just because they are new technology? For mappers, is it really just another platform for obtaining remotely sensed data, to take its place along with satellites, space shuttles, aeroplanes, helicopters, balloons, kites and pigeons? Perhaps once humanitarians and social media shakers and movers accept this, they can ignore both the platform and how the data is captured and get down to looking at the information itself and how we can make better use of it.
We have focused above on the UAV sector, but the space sector also needs to be much more aware of the same parameters for good humanitarian information outlined above. In this sector, too, there are plenty of new innovations, which may have the potential to be game-changers. Humanitarians, not just the information management specialists who love all things technological, but field operators and project managers, should be made very aware how fast this sector is transforming and expanding, and help guide it in what are their true information needs. We’re back to needing a more informed dialogue.
Some areas where the space sector will potentially assist are in the exponential growth of platforms, primarily through microsatellites. New radar sensors will literally make us see better with their penetrating gaze through the clouds. While general visible sensors will always have a place, the accessibility, resolution, sensitivity and specificity of physical monitoring sensors; fire detectors, vegetation mappers, water detectors, temperature gauges, will provide very targeted products that humanitarians should tap into.
The challenges for use of space sector services are similar to those in the UAV sector. Are the solutions they provide appropriate to the problem they aim to solve, whether it be measuring the extent of the affected area or helping value the damage to assets? And how cost effective is it to transfer those solutions to the people who need them on the ground so they can make the right decisions, at the right time?
In many ways the list of innovations listed above is nothing new – meteorologists for example will tell you targeted sensors are old news. Radar has been around since 1940s. But it is both the proliferation, the usability and the fast widening access to these resources by non-specialists which is starting to gain purchase in the humanitarian field.
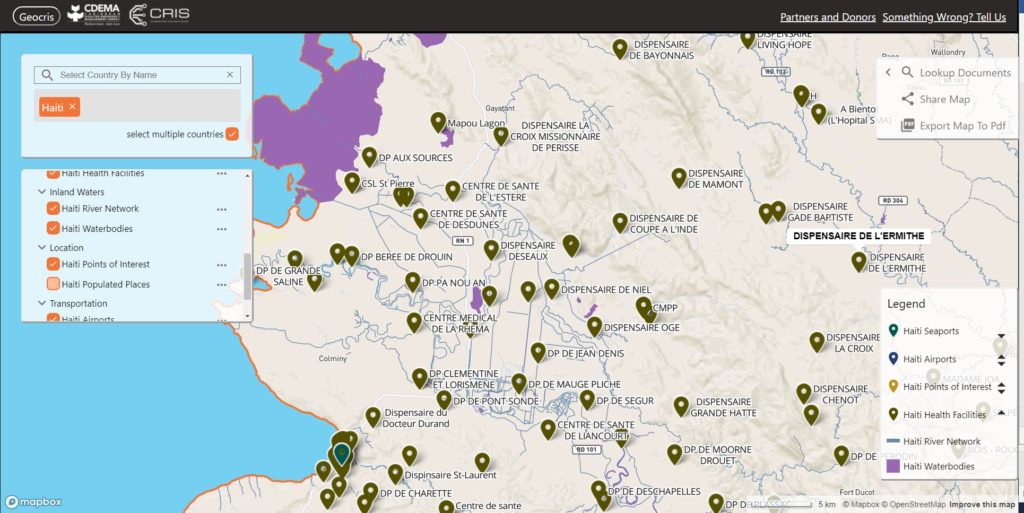
Is there a risk of drowning in a sea of data? Humanitarian data continues to proliferate and responders and information management officers can be overwhelmed by data, even early on in an emergency response. Finding those data can be a challenge, as much as being over-provisioned by well meaning data providers as soon as you declare you are heading for the disaster. Clearing houses, portals and nodes are multiplying almost as fast as data sources. Many offer focused locations to get hold of data, but they vary in quality, structure, searchability, relevance and long term management. As humanitarian mappers, we at MapAction know how frustrating it can be to spend significant time sifting through these sites to get that one set of truly useful data that our customer has requested urgently.
MapAction will continue watching the horizons of technology to see what innovations may make our operations and outputs more effective. We are happy to engage with technologists to build understanding of the needs of humanitarian relief to produce targeted, appropriate and timely solutions. We are happy to replace old solutions with new, such as using more accurate elevation data than SRTM. However they must meet both humanitarian technical requirements – suitable resolution and accuracy, for example – and practical & logistical requirements – working with limited bandwidth, digestible in quick time, interoperable with commonly used systems. We don’t use data sources or services because they are new, but because they are better than anything else.
Ultimately, it is time to change the way we use remotely sensed data in humanitarian response. We do need to shift from technology driven, supply side innovations to an iterative process of system evolution. Where this is successful, humanitarians will clearly express their information needs for getting aid to the right place when it is needed following a disaster, amid what, by their nature, are difficult conditions . And technologists must understand the restricted parameter of these difficult conditions and provide appropriate, streamlined, effective tools.
The situation after a disaster is by its nature chaotic, distressed and difficult to operate within – in short, confusing. Any tool or data source which exists to help within that system should be targeted at alleviating the confusion and ensuring that the affected communities and individuals are at the heart of any solution.
Remotely sensed data do not and will not solve humanitarian information management problems by themselves. Their added value comes from combining these data effectively with other digital map, survey and ground-based information. Simple, focused solutions from technicians will work best – but only where they are interoperable with other data sources, multiple systems and open for use by all responders.


 At the same time, two MapAction volunteers travelled to Yerevan, Armenia, to support the International Search and Rescue Advisory Group’s (INSARAG) regional earthquake response exercise with maps. This simulation exercise was particularly poignant, coinciding as it did with the 30th anniversary of the Spitak earthquake, which killed over 25,000 Armenians and injured over 130,000 more.
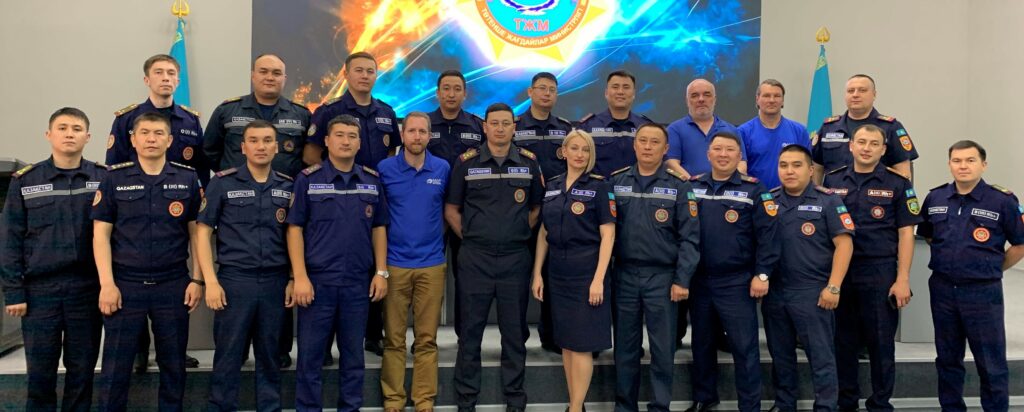
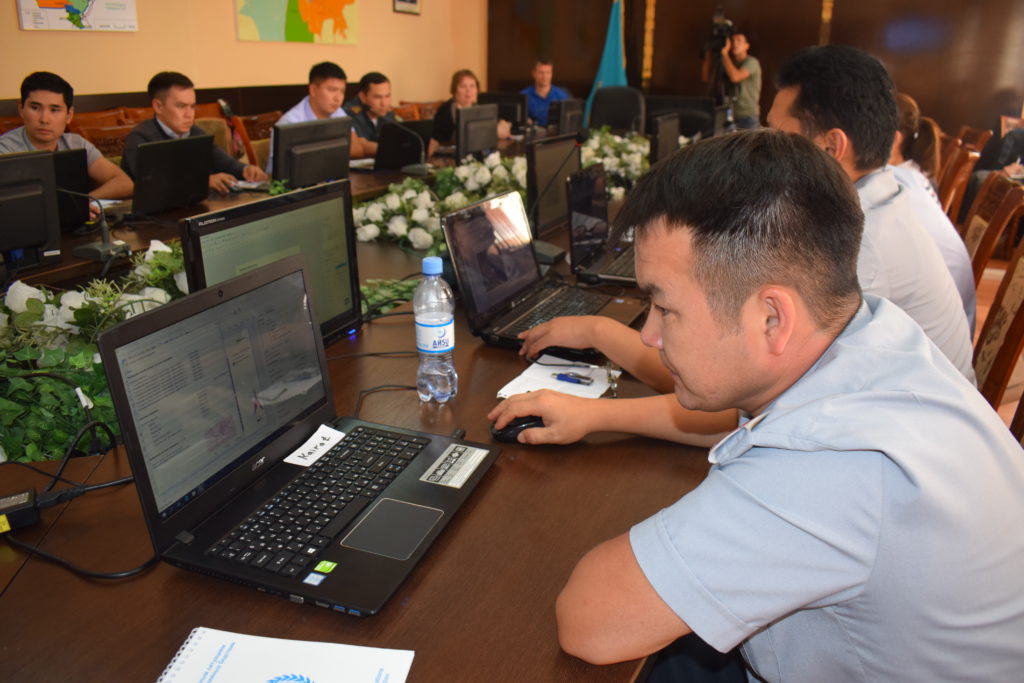
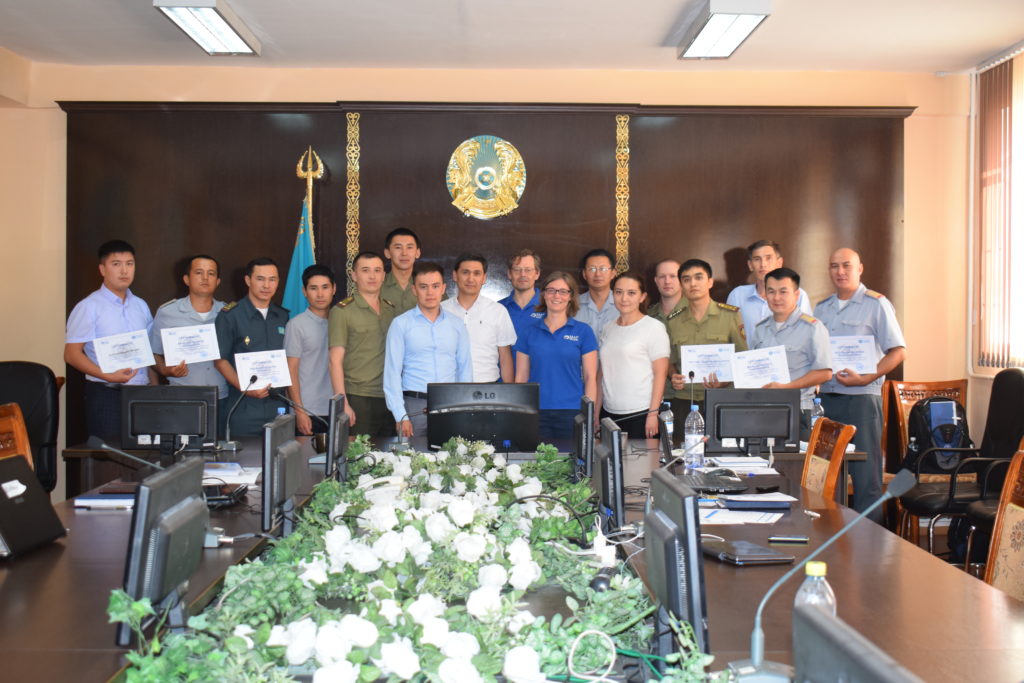
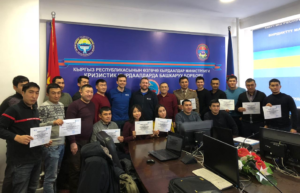 A further two MapAction volunteers were in Bishkek last week to deliver a package of training on mapping, data collection and data management for national disaster management agencies.
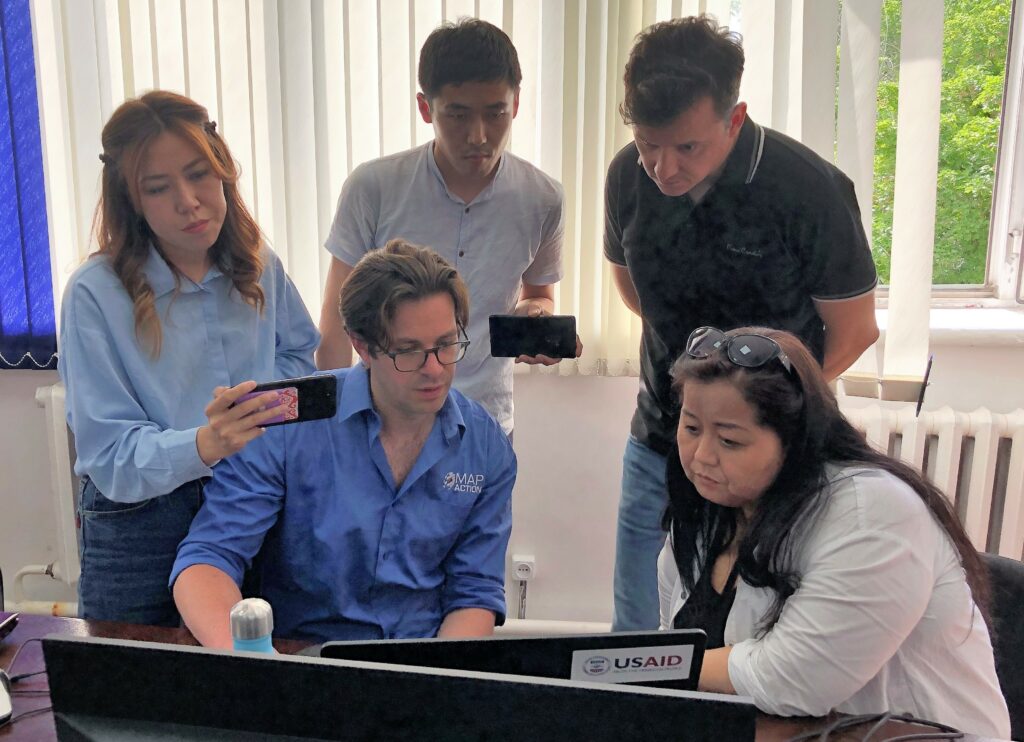
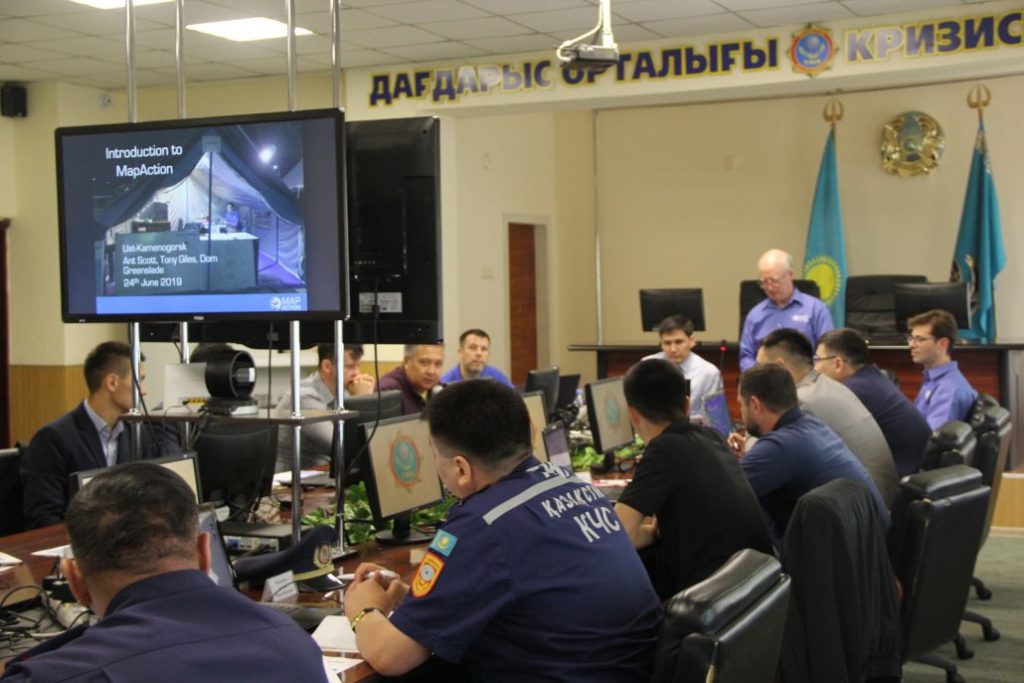
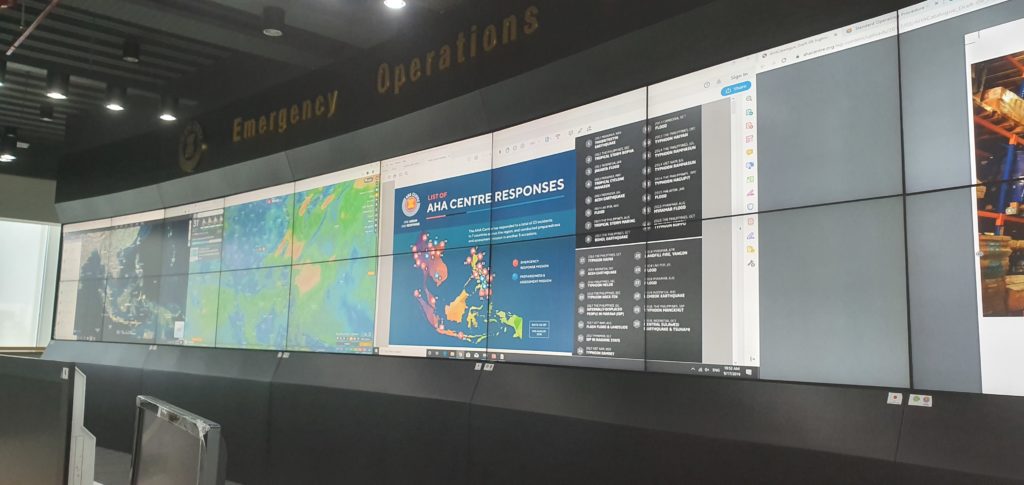
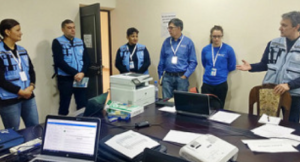
 MapAction volunteer Ian Coady was in Banten, Indonesia, last week, with our partner the AHA Centre, which is the Association of Southeast Asian Nations (ASEAN) Coordinating Centre for Humanitarian Assistance on Disaster Management. Together they were taking part in the seventh ASEAN Regional Disaster Emergency Response Simulation Exercise (ARDEX).
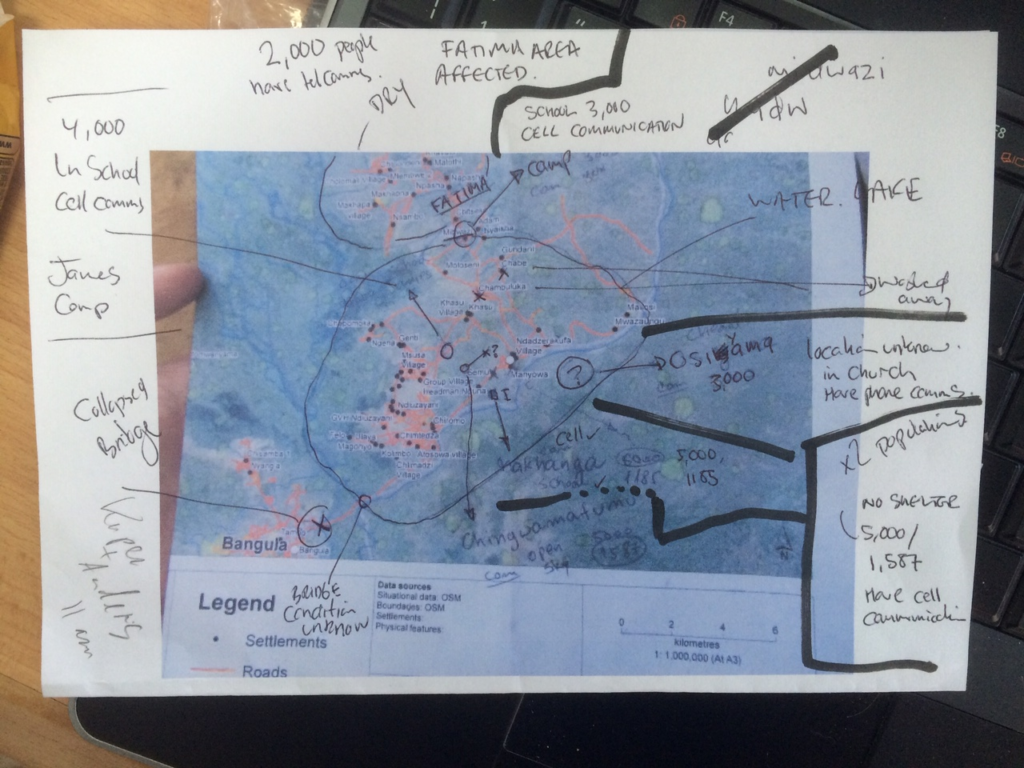
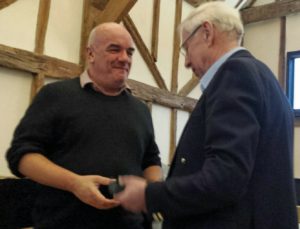
 MapAction trustee Barbara Bond is an author and geographer whose senior leadership roles have included president of the British Cartographic Society, senior civilian Director and Deputy Chief Executive of the UK Hydrographic Office and Chair of the International Hydrographic Organisation’s Antarctic Commission. Among other accolades, she has received the British Cartographic Society’s silver medal and the Prince Albert I medal and been inducted into the US National Geospatial-Intelligence Hall of Fame.
 USA, 20 July – MapAction was presented with the Humanitarian GIS Award by ESRI in San Diego in July.
 UK, 10 June – MapAction has published the first edition of its Field Guide to Humanitarian Mapping. The guide, which is downloadable free, will help aid organisations to use geospatial tools and methods in their work in emergencies. There are tutorials for Google Earth and open-source GIS software.
 .jpg)