By Lavern Ryan, MapAction volunteer.
“Alert Check: Volcanic Eruption St Vincent and the Grenadines, please sign up your availability.” Those were the words which greeted me as I checked my MapAction email. Simple words, but so profound for me. They really hit hard, and hit home! I could not ignore that call for action. I signed up for remote deployment. It turned out to be my first official response deployment as a MapActioner!
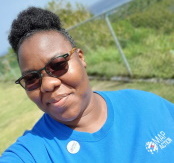
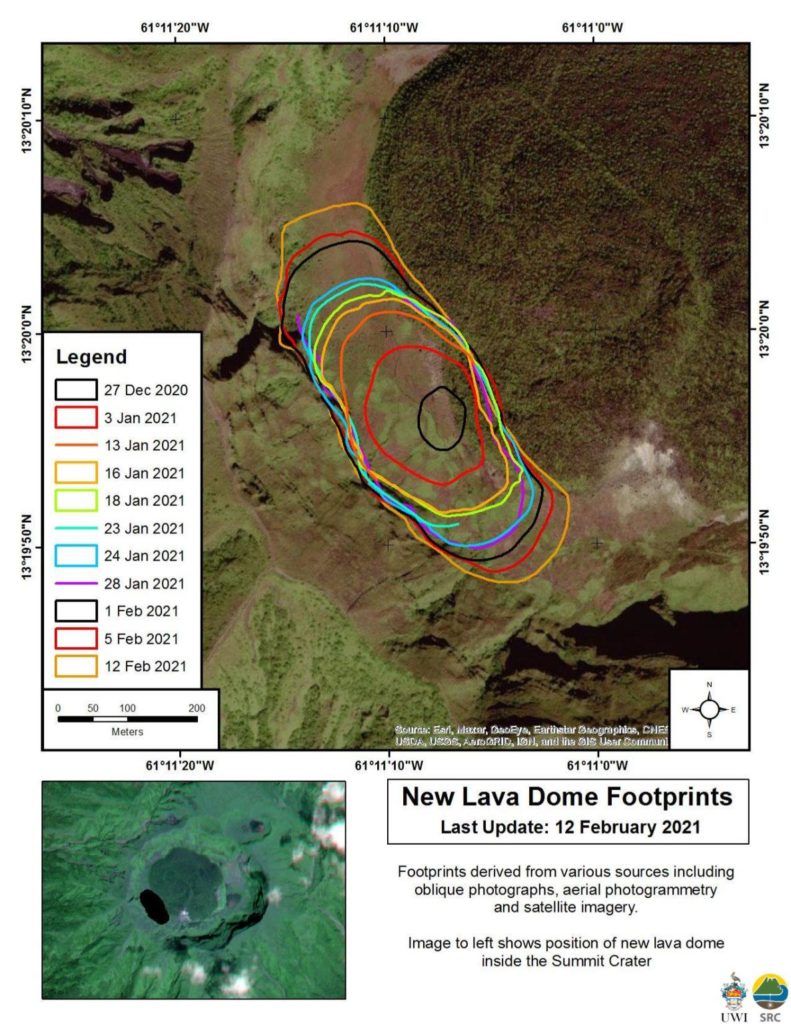
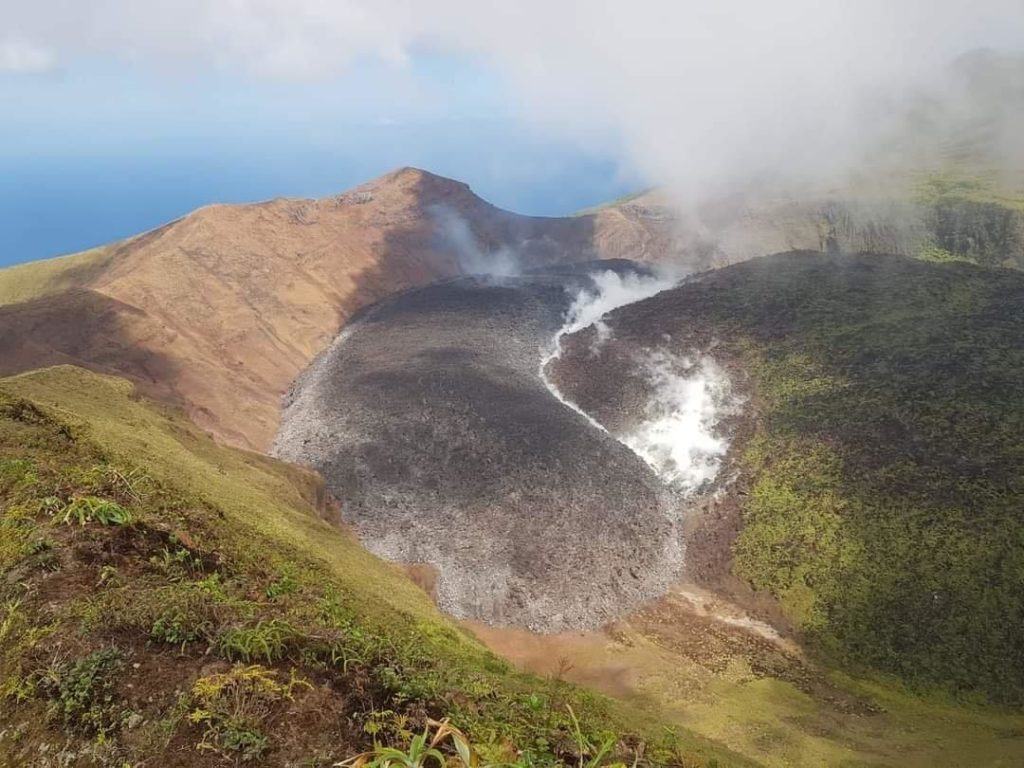
Like many people within the region, I have been observing the volcanic dome growth in St Vincent and the Grenadines since late 2020. As it grew, magma continued to fill the space around the old 1979 dome, as depicted in the images below.
A period of elevated volcano-tectonic (VT) earthquakes, which began on 23rd March, 2021, indicated to scientists that the situation at La Soufrière had deteriorated. An evacuation order was issued on April 8, 2021 by Prime Minister Ralph Gonsalves.
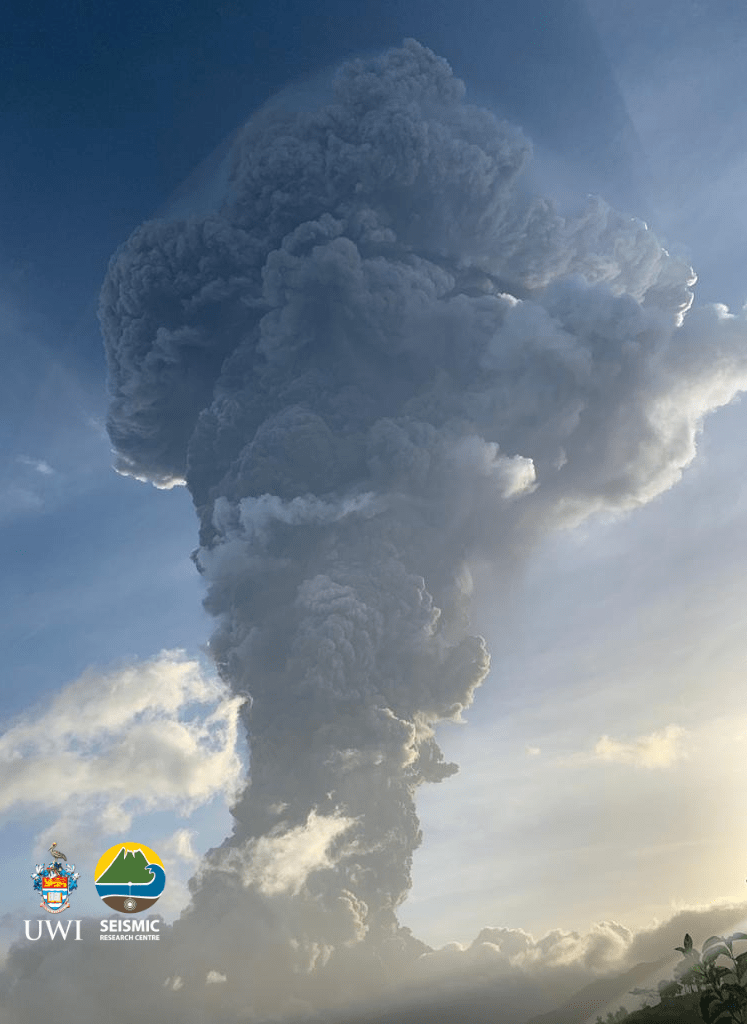
The very next day, on April 9, 2021, La Soufrière Volcano erupted! The eruption was very visible to people around the world due to the prominence of posts on social media. It was easy to see live feeds and video posts as the action unfolded. Images of the massive mushroom plume created by the eruption brought back so many memories for me. It was beautifully dangerous!
Having experienced the eruption of our very own Soufrière Hills Volcano in Montserrat and having lived with an active volcano for the past two decades, I empathised with the residents of St Vincent and the Grenadines. Being displaced from one’s home to live in a shelter is no easy feat. Having to leave behind the beloved island you call home is even more challenging. I knew the road ahead for many people would be long and difficult. Hence my conviction to help in the best way I knew: – by providing geospatial support.
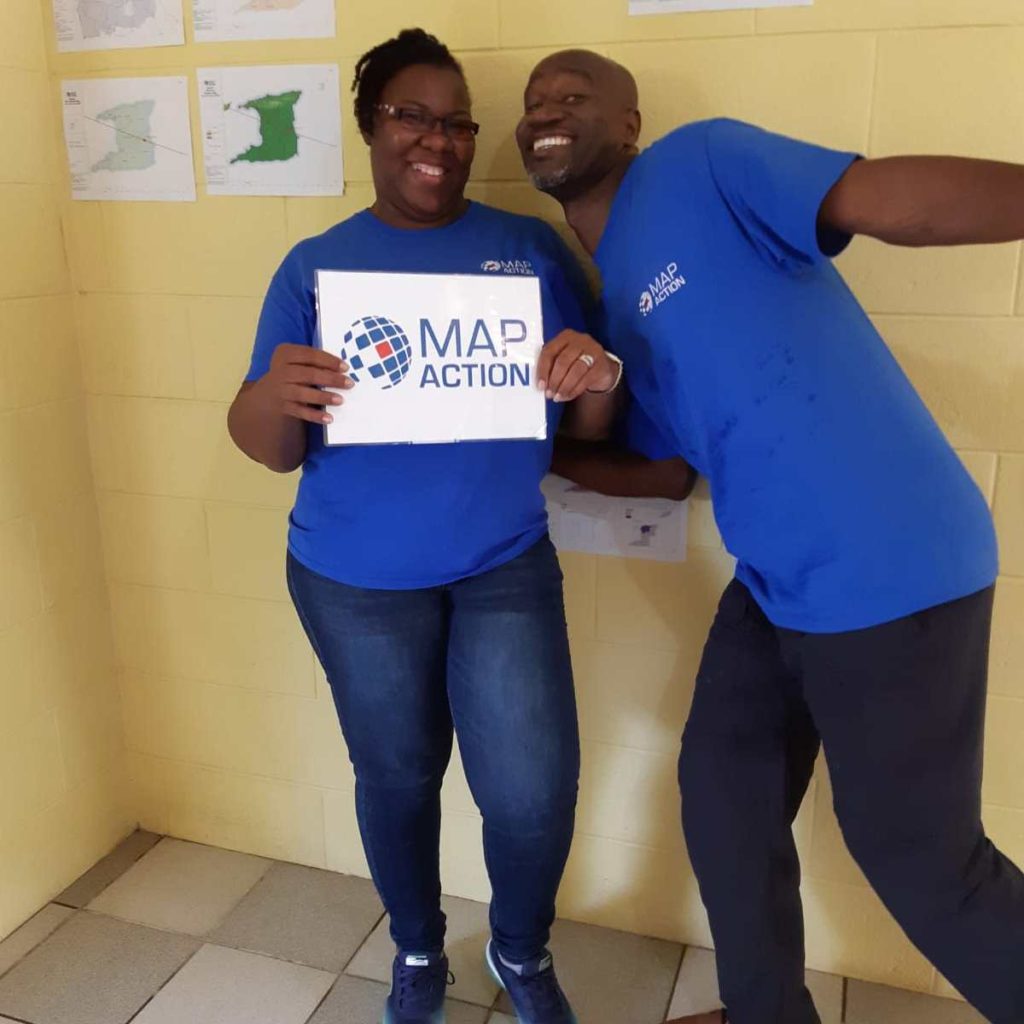
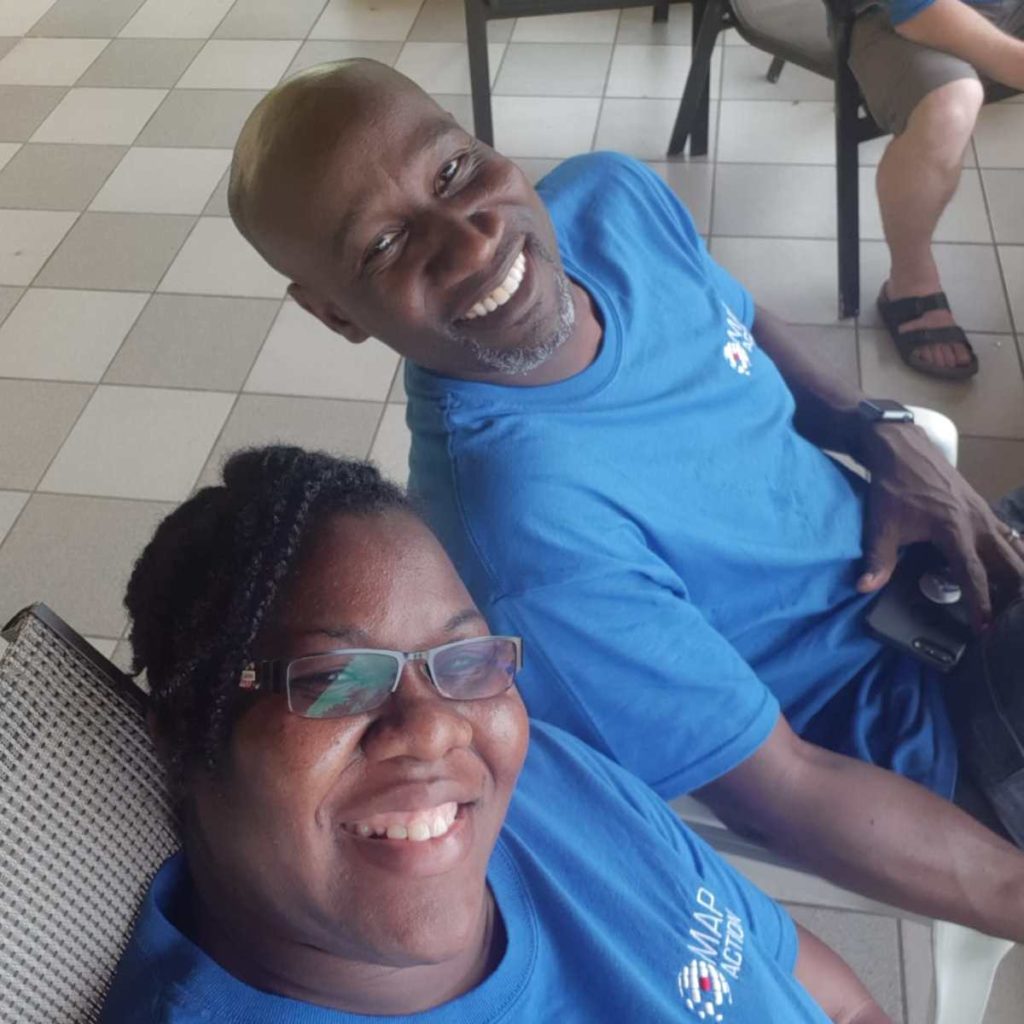
It was great news to discover that Mike was also selected as a member of this remote deployment team for the St. Vincent Response. Mike and I were recruited at the same time in 2019 to form part of the Caribbean Section of MapAction. The picture below is a throw-back to June 2019 in Trinidad. We had several days of intense conversion training sessions. In retrospect, those days really set the foundation for our ability to deliver during this response.
Our team was led by Matt who resides in New Zealand. He is very knowledgeable and has significant experience in deployments. We also received additional support from another volunteer, Pip, who is located in the UK. We supported the Caribbean Disaster Emergency Management Agency (CDEMA) for a period of three weeks. Subsequently, another two volunteers, Ant and Jorge, were deployed to support the environmental work of the United Nations Environment Programme’s (UNEP) response. We represented different time zones and locations from across the globe.
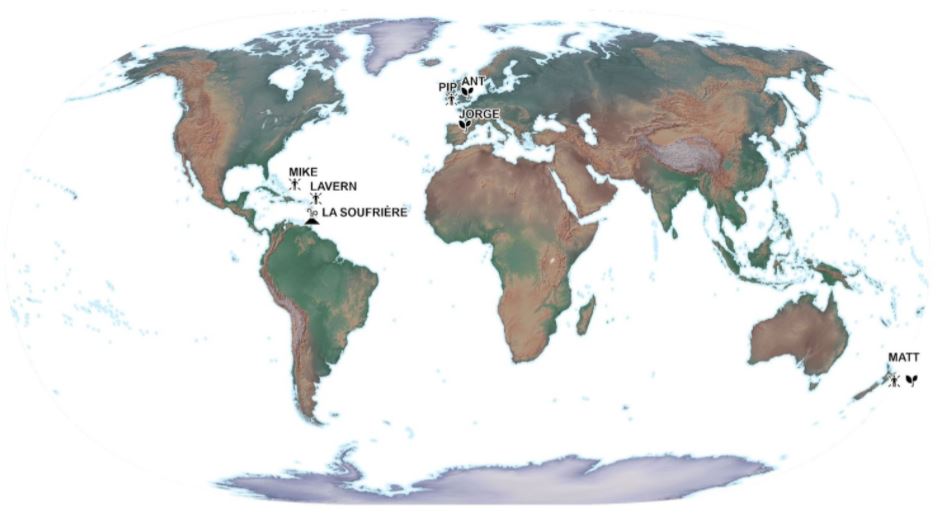
This unique team selection, worked out very well, as it offered 24 hour coverage for the St. Vincent response. Mike and I, being located in the Caribbean region, were uniquely placed to attend briefing meetings in our local time zone and follow up with any new developments; while Matt provided another level of support from New Zealand, as his day began when ours was coming to an end. No sleep lost – I guess! Our daily briefing meetings allowed us to report our findings during that day and to strategise the allocation and completion of tasks.
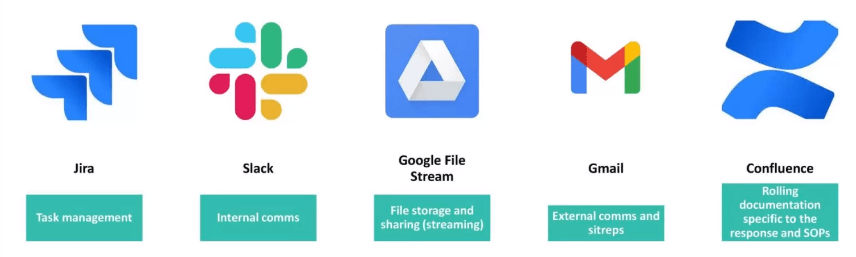
MapAction has mastered the ability to use different tools to share and work together in a remote working environment. In my opinion, the COVID-19 pandemic has only strengthened this area. The image below highlights some of the main tools we used to ensure smooth deployment coordination.
One of the major needs of any emergency response is geospatial data. The ‘data scramble‘ as the term is coined, involves the researching, collating and organising of all the spatial data available for a particular location, ensuring that it is fit for purpose. The data collected was prepared by transforming it into the correct projected coordinate system to allow for overlay and integration between different datasets. Datasets included administrative boundaries, such as parishes, census districts, shelter locations, elevation data, transportation networks, buildings, land use, hazard zones, and health centres, just to name a few. These were placed in appropriately themed folder locations so that it would be easy for deployed members to find them during the response.
Coordinating with CDEMA, MapAction provided mapping support to to aid in visualisation of the situation on the ground.
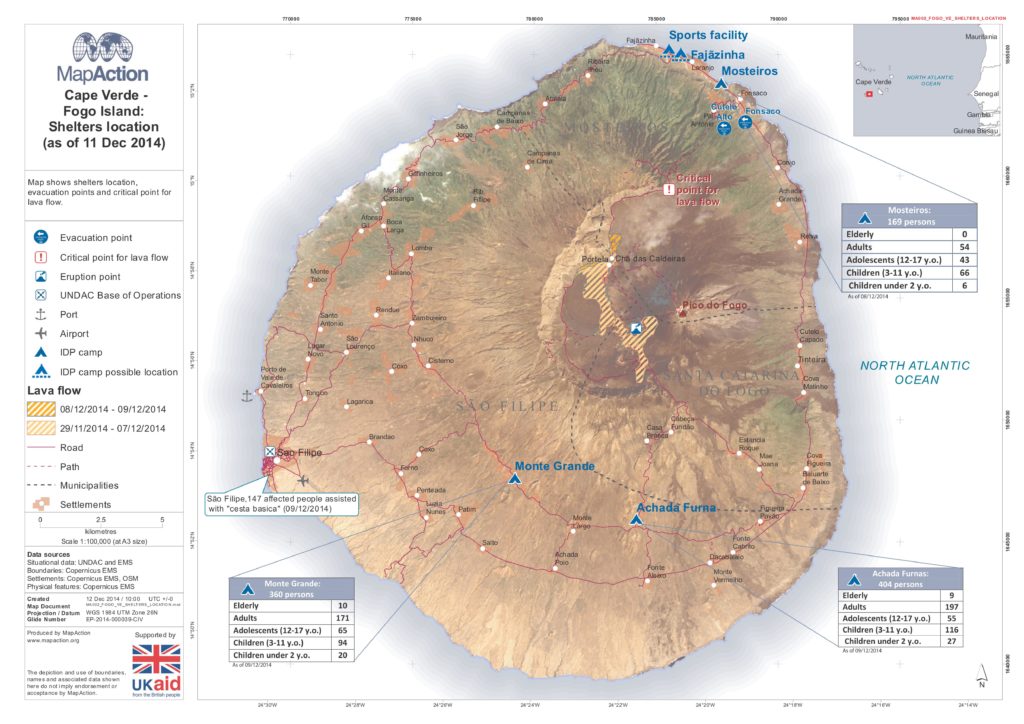
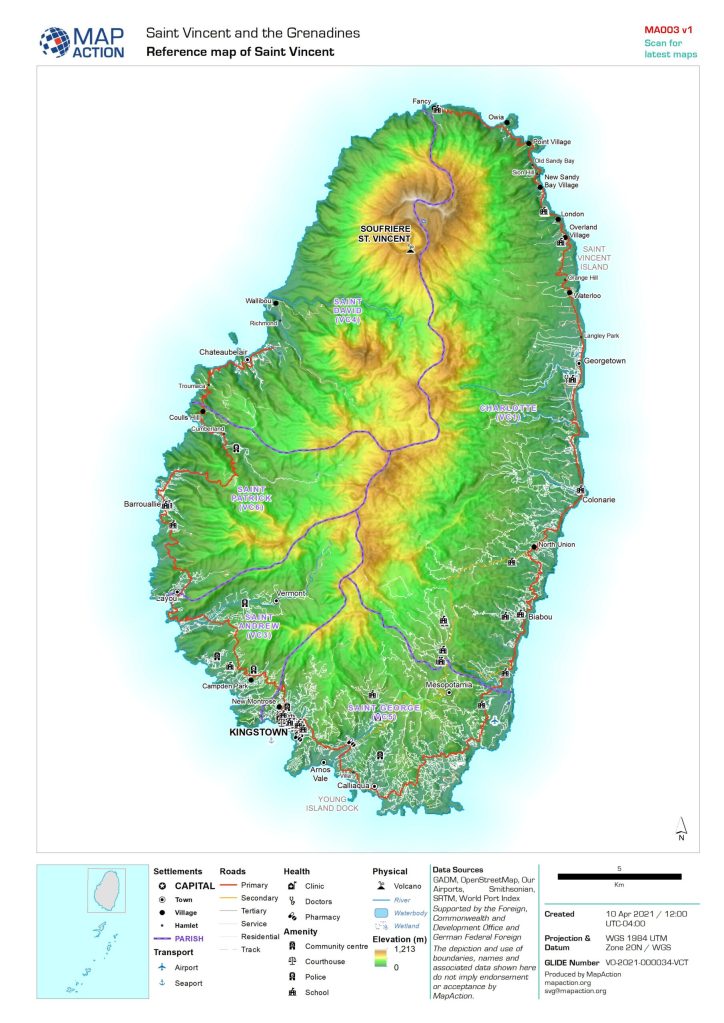
One of the first maps prepared is a reference map of the area. I consider this to be one of the most important maps to be prepared, as it gives context to the area of interest. Everything else is built upon this.
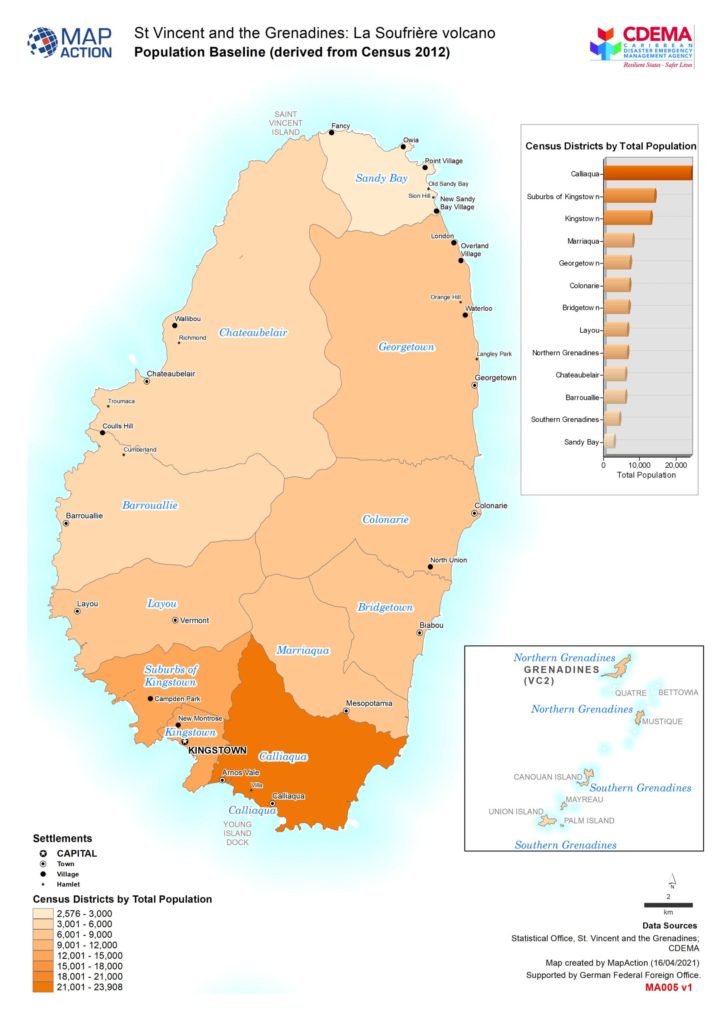
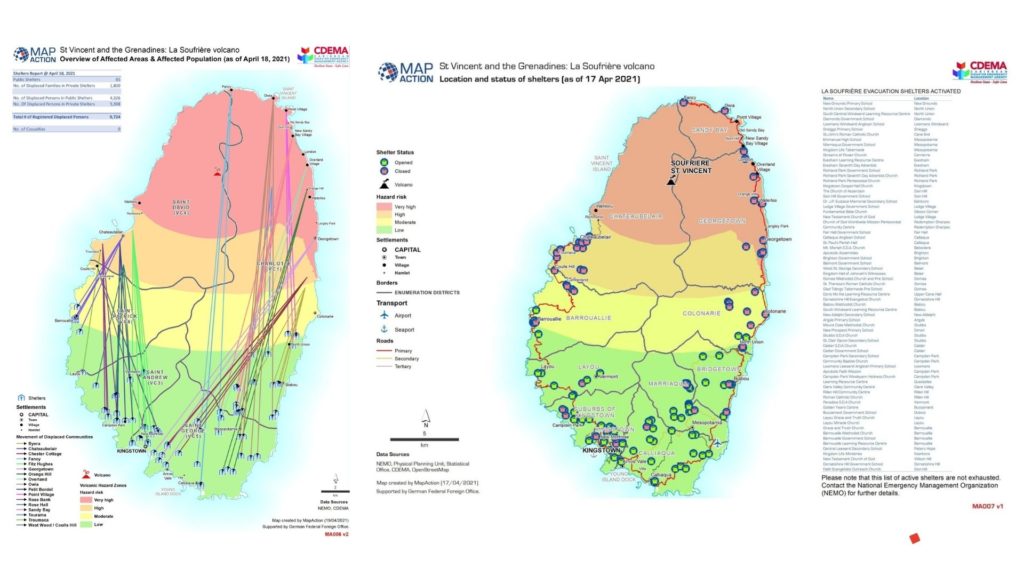
The basemap shown on the left below is detailed with settlement locations, roads, parishes, village names, rivers and elevation data. The baseline map sown on the right, highlights the population figures of St.Vincent derived from the most recent 2012 census survey. This allowed us to understand how the population is distributed throughout the affected areas.
To provide further understanding, situational maps were prepared. Data being shared through situation reports from the Emergency Management Agency allowed us to create visual representations of what was happening on the ground. The map on the left, shows movement of displaced people from affected communities in the red, orange and yellow zones. The map on the right shows the location and status of the shelters.
Additionally, a 3D webmap was created showing the key volcanic events and hazards of the La Soufrière volcano. This dynamic map allows you to explore the data which was used to create the maps above and offers a better understanding of the risk posed by the volcanic eruption in St. Vincent.

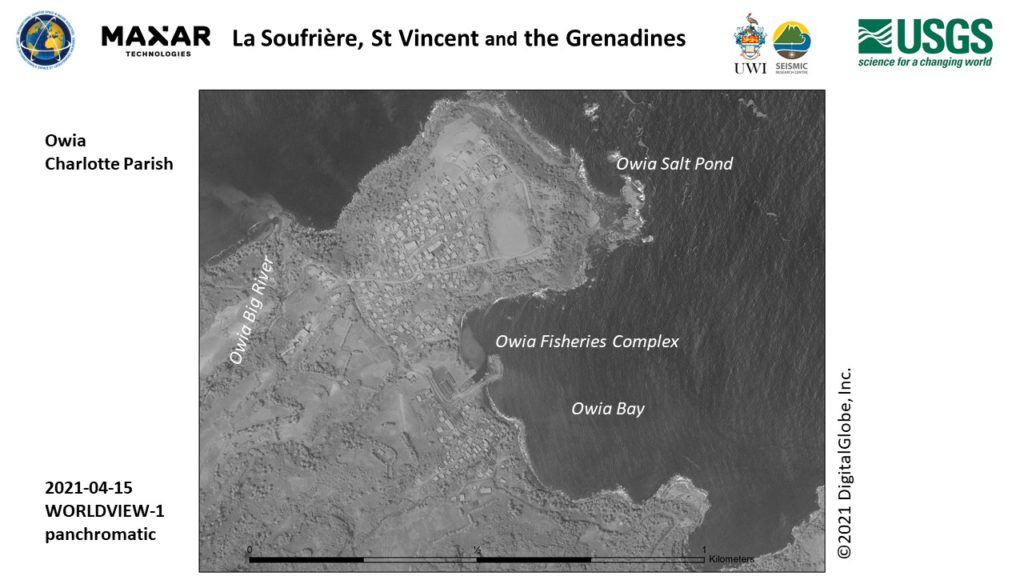
Working so closely with the data from St. Vincent during this period of time, allowed me to become very familiar with areas and village locations on the island. Seeing feeds on social media allowed me to identify quickly with where things were happening. Names such as as Chateaubelair, Troumaca, Byera, Owia and Fancy stood out to me!
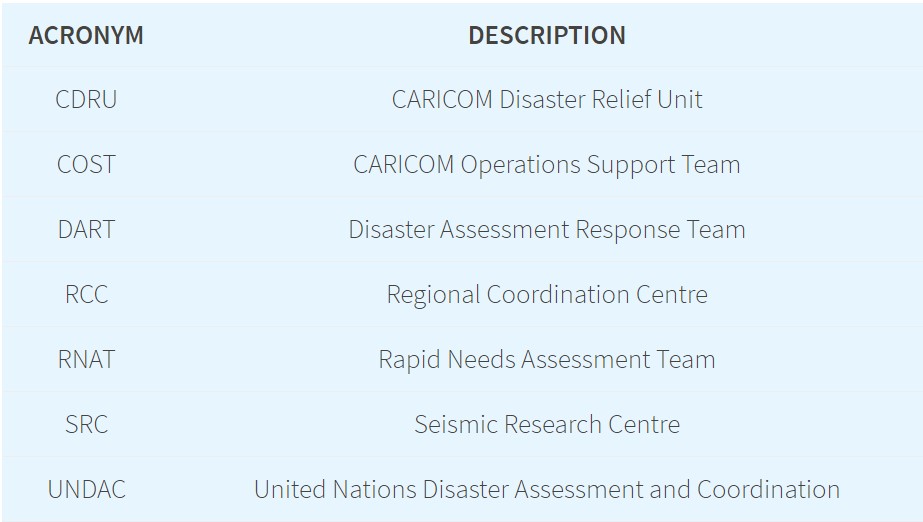
During my remote deployment, some acronyms were mentioned frequently during our briefing meetings. I eventually got the hang of them! These all form part of the response mechanism which helps the crisis on the ground to be addressed. Each of the teams highlighted below, played a very important function in being able to get supplies into St. Vincent, assessing the needs of the population and understanding the impact of the disaster on the island.
A number of other international organisations responded to the crisis in St Vincent and the Grenadines by activating their disaster response mechanisms and programmes. The links below provide additional insight into their response activities.
- Copernicus Emergency Management Service
- The International Charter Space and Major Disasters
- Maxar: Open Data Program
- Nasa Disaster Program
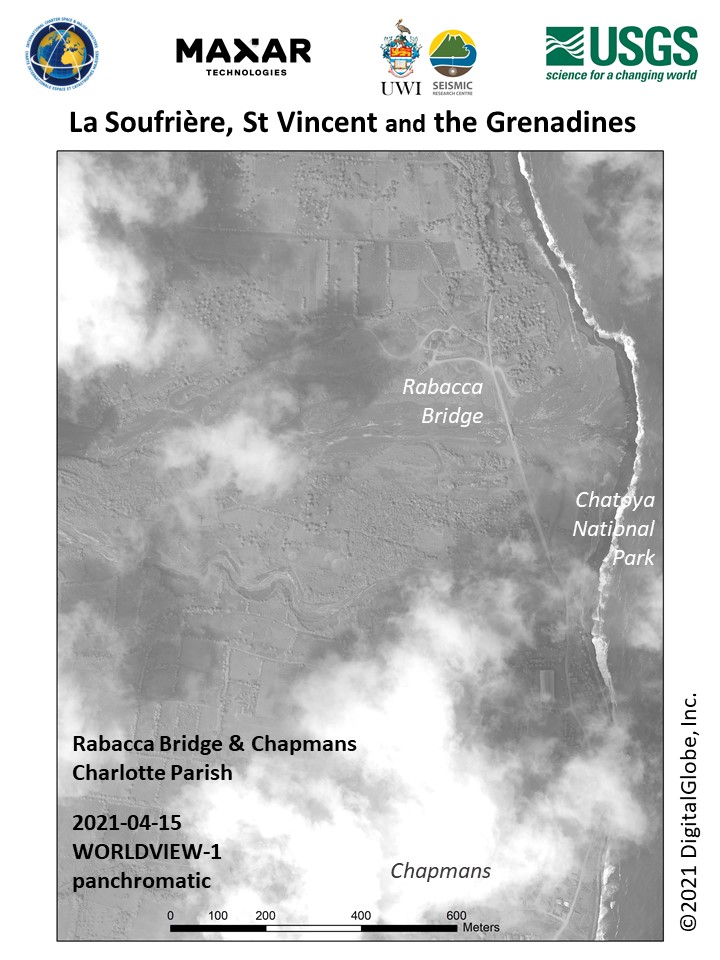
Satellite images like the ones below were captured as time progressed and further mapping and analysis was carried out. Derived information proved useful to responders on the ground.
MapAction is known to respond in-person during an emergency response deployment. Although the COVID-19 pandemic has limited this, my experience through this remote response deployment has shown that MapAction’s involvement is still significant in providing geospatial information to support the humanitarian needs of people in crisis. I do look forward to future deployments with MapAction!
This article was first published on Lavern’s own blog on 24 May 2021.