CoP 28 : Good use of data is key to mitigating the climate emergency 

MapAction urges world leaders and stakeholders gathered at COP28 to promote data-driven solutions to improve the lives of people on the front lines of climate change. (A version of this article was first published before CoP27 in Egypt in 2022. It was updated for CoP28 in November 2023. )

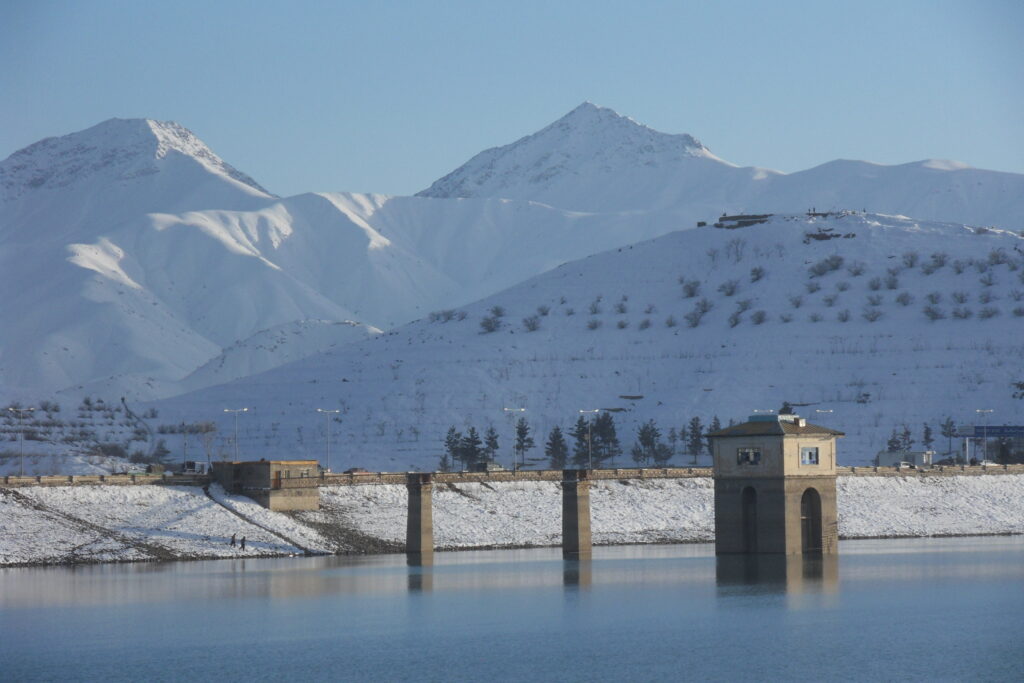
In recent years we have seen a large increase in the number of natural disasters worldwide. Regular climate-related disasters are exacerbating water and food insecurity. 

How emergency relief stakeholders and governments coordinate their responses to the climate emergency can impact the recovery of affected communities. That is why good data is key to preparedness and mitigation, especially in locations with limited resources. 

Ice and snow on the Hindu Kush mountain range, which runs along the Afghanistan-Pakistan border, is melting and causing devastating floods in both countries. Photo: MapAction

As the changing climate ravages and displaces some of the world’s poorest communities, good data use will not prevent such climate-driven occurrences. It can only soften the effects by helping the affected communities, and stakeholders, to be prepared and to coordinate relief strategies. Good use of data in decision-making at key moments can reduce the human cost of the climate emergency. 

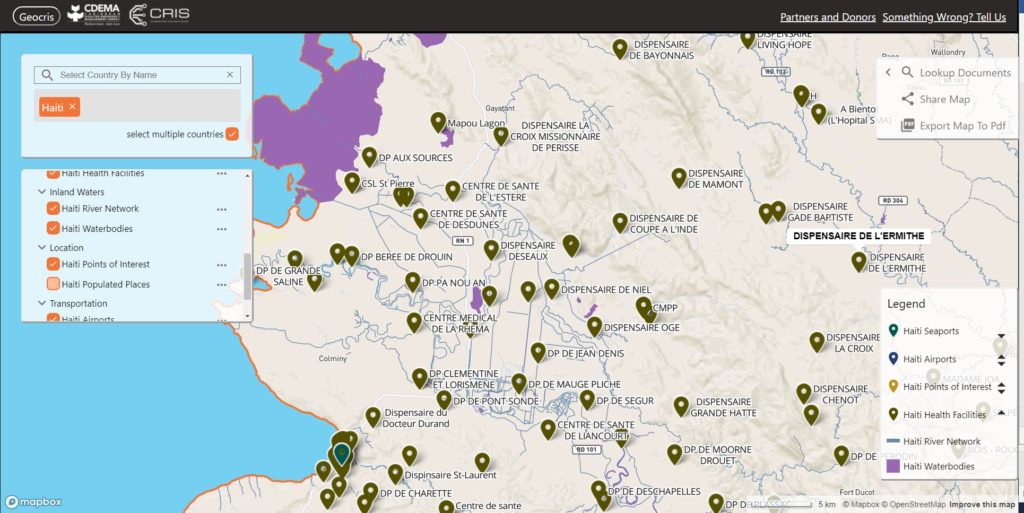
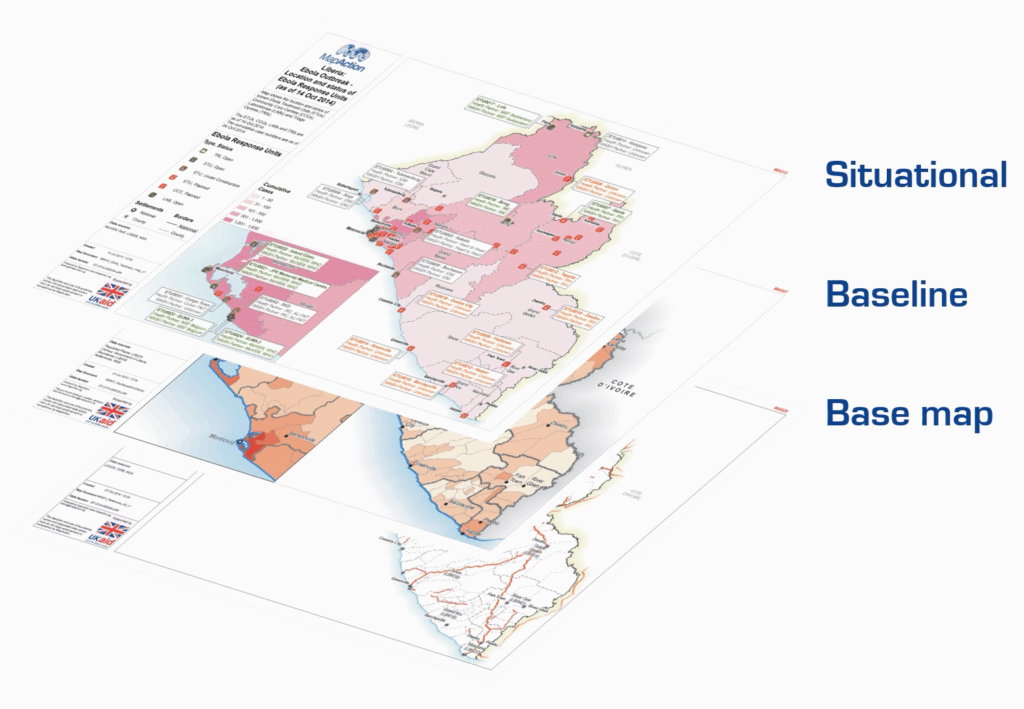
“Data, often visualised through maps, can help identify who the most vulnerable people are, where they are, and highlight need,” said Nick Moody, MapAction’s chair of trustees, before CoP27 in 2022. “At CoP27 there was a recognition that while this information is critical during a crisis, it can have an even greater effect if used in advance. MapAction has a huge role to play in helping others to build resilience through data.”

Why MapAction?

Since MapAction’s inception over 20 years ago, the charity has provided data and specialist technical geospatial and data volunteers in more than 140 crises, many climate-related, worldwide. Our team has supported responses alongside UN, regional and national agencies as well as INGOs and local civil society organisations, providing relief to some of the most vulnerable climate-exposed people worldwide. 

READ ALSO: MapAction urges wider adoption of GIS for disaster resilience at UN Expert Meeting

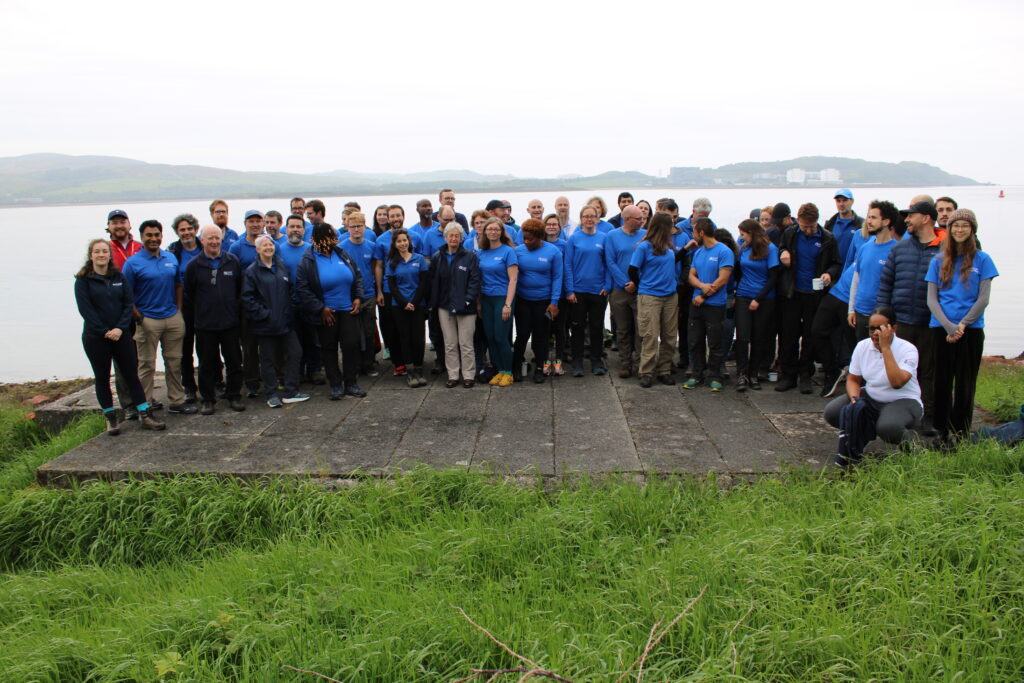
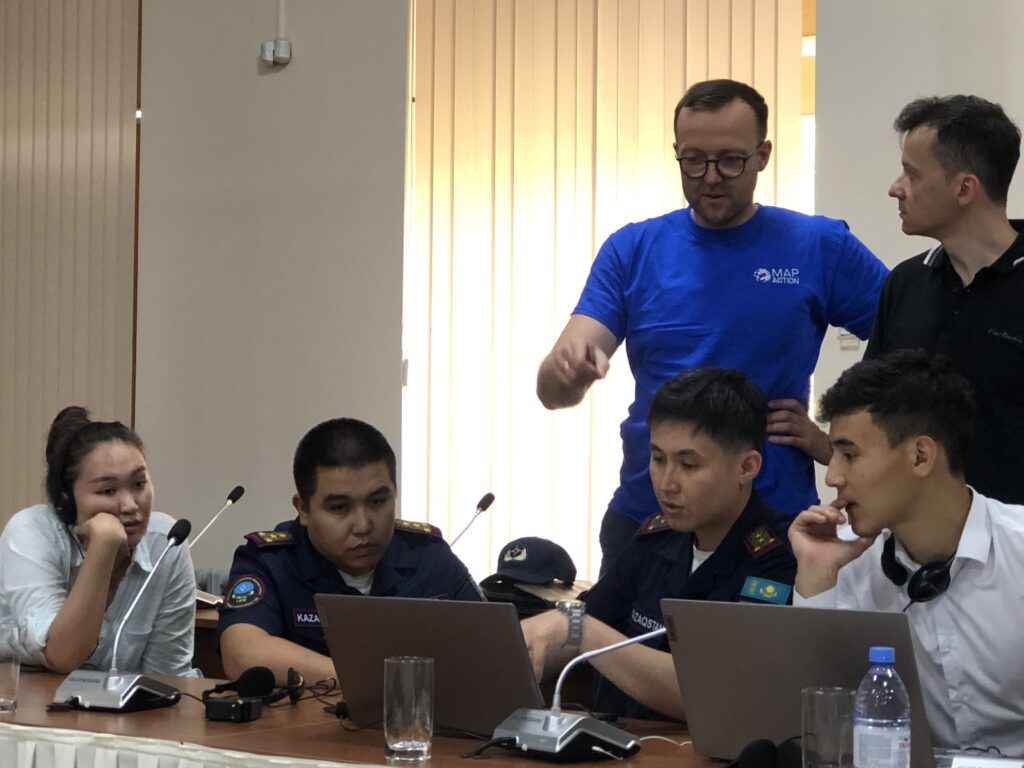
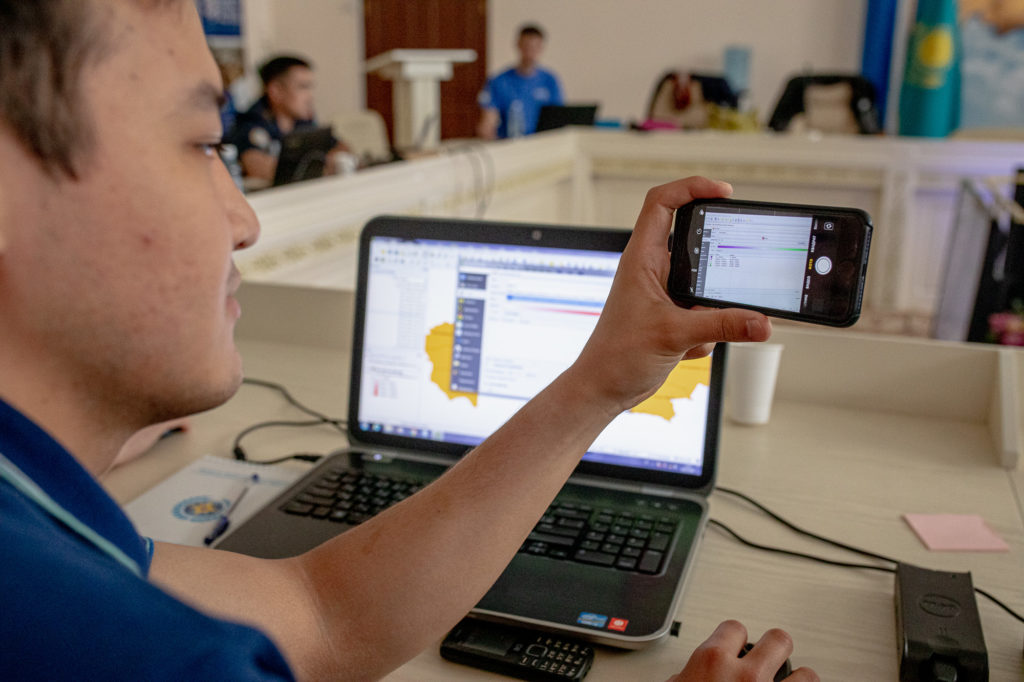
Our 70+ volunteers come from across the ever-growing range of sectors using data and geospatial technology, bringing a huge diversity of technical expertise. MapAction gives them the training, operational experience and support needed to operate effectively in humanitarian situations. 

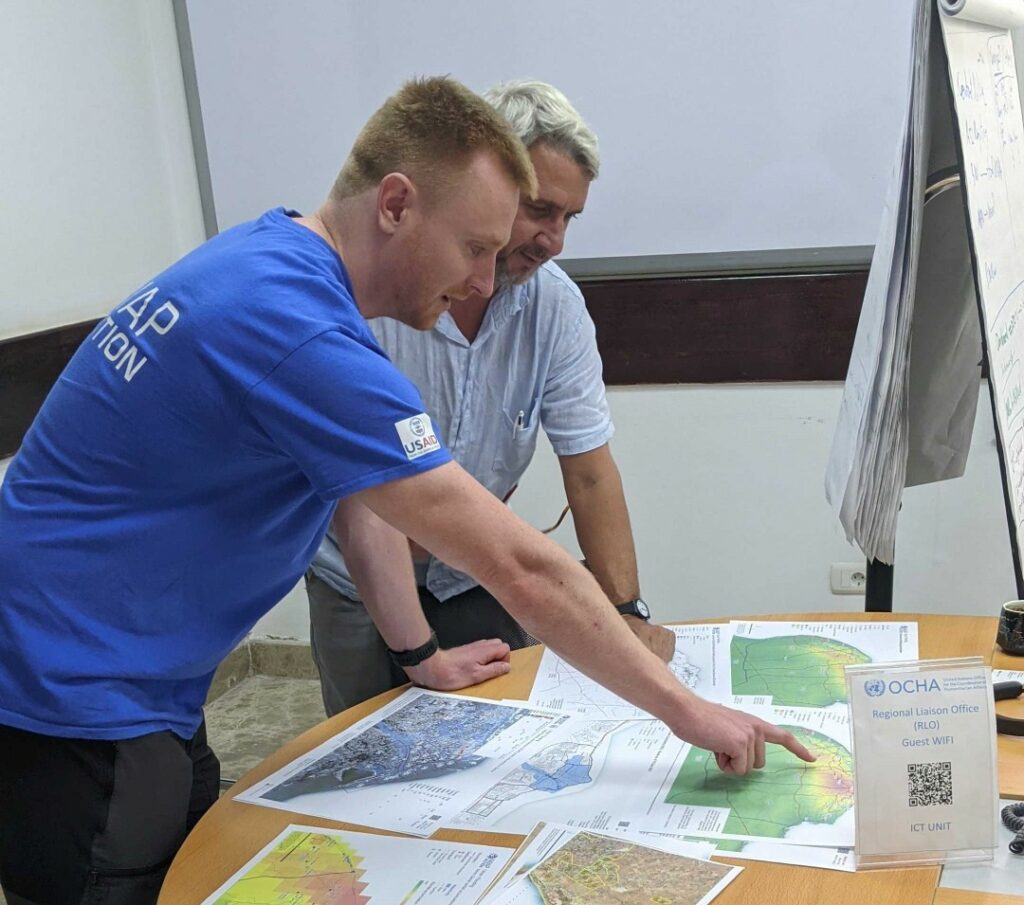
Working in collaboration with many emergency relief partners, our teams create unique situation maps, data visualisations, data sets and other products that help coordinate disaster relief using the best available information in the most insightful ways. The improved decisions they enable can help mitigate, for example, the impact of droughts, floods, hurricanes, earthquakes, famines and health crises, to save lives and protect communities. In 2023 alone, MapAction has provided data products, volunteer mapping teams or experts to support emergency response, anticipatory action programmes or capacity building in a dozen countries in five continents.

READ ALSO: MapAction continues to strengthen global disaster preparedness in summer of 2023

From response to anticipation

While MapAction’s initial expertise was in support of emergency response, our work is increasingly moving into early warning and preparedness. Anthropogenic climate change has been proven to alter both the likelihood and the severity of extreme weather events around the world, and the growing frequency of these can be predicted, if not precisely then generally. Being ready to spot the indicators, triggering early support for anticipatory action can be life-saving. Predictive analytics can allow us to define the mechanisms that trigger these actions by analysing current and historical data and developing models, as long as the data is reliable.

READ ALSO: Why we must address the gender gap in humanitarian data

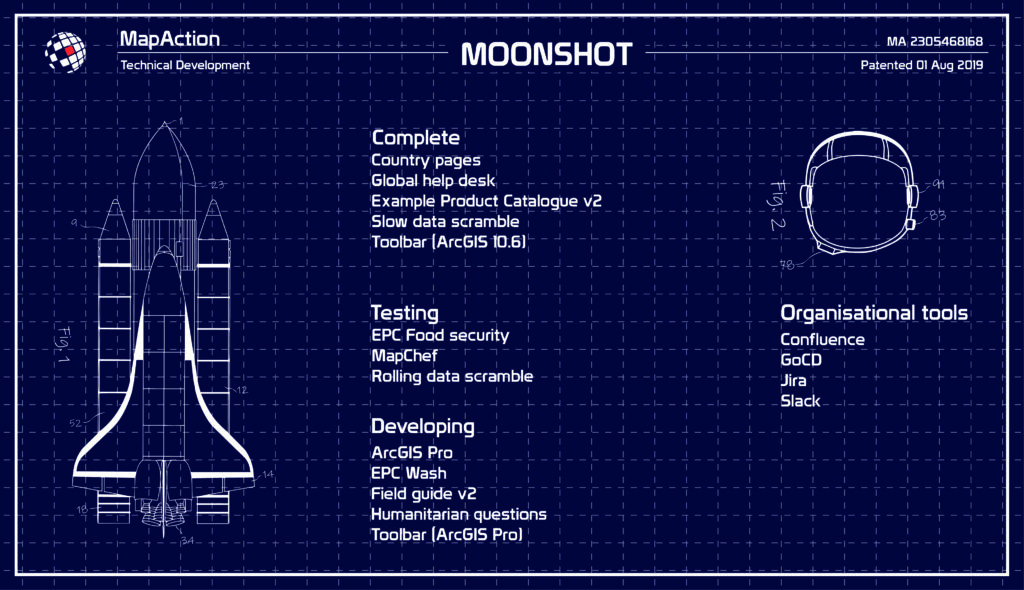
“It is more important than ever to be able to respond effectively to such events, but also to be able to anticipate them, in order to more effectively mitigate their impact,” Daniele Castellana, former lead Data Scientist at MapAction, commented before CoP27. “Through our collaborations with the Centre for Humanitarian Data and the Start Network, MapAction has been working on this flourishing component of humanitarian aid.” MapAction launched its own InnovationHub in 2022.

READ ALSO: MapAction Data Science Lab: the story so far

Early action is one of the most effective ways to address the ever-growing climate impacts. That is why MapAction has partnered with the START Network, a coalition that focuses on humanitarian action through innovation, fast funding and early action; Insurance Development Forum is also a partner in this work. START Network brings together 55 international non-governmental organisations and 7,000 partners worldwide. MapAction is also working with INFORM to support updating forecast and risk models with select national disaster management agencies worldwide.

READ ALSO: 7 Country Missions Completed Successfully as Part of Phase 1 Programme for Anticipatory Action and Disaster Risk Reduction

From commitment to action

MapAction has made concrete commitments to actively seek solutions to reduce the impact of climate change. In October 2021, we signed the Climate and Environment Charter for Humanitarian Organisations. The charter was developed by the International Committee of the Red Cross (ICRC) and the International Federation of Red Cross and Red Crescent Societies (IFRC), and guided by a 19-person strong Advisory Committee which included representatives of local, national and international NGOs, UN agencies and National Red Cross and Red Crescent Societies, as well as academics, researchers and experts in the humanitarian, development, climate and environmental fields.

Signing that charter commits us to being a part of the solution and helping people adapt to a changing climate and environment. It will also help strengthen our own resolve and efforts to be environmentally sustainable. Most of all, it recognises that our efforts must be a collective endeavour – no organisation can tackle this alone.

Together with a growing range of partners, looking to engage ever more locally, we are using geospatial data, data visualization and data science to start laying the groundwork for climate resilience. The objective is to improve preventive actions and strategies in humanitarian response. 

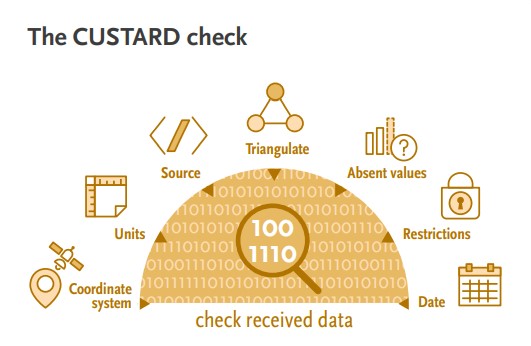
Because what we map today we can mitigate tomorrow and in the future. That is why the science of how we source, analyze, shape, share and deploy data must be at the heart of all current and future discussions on adapting to climate change. 

For more info on MapAction’s work, please drop by our website

You can also follow us on Twitter, LinkedIn or Instagram

If you haven’t yet done so, please do subscribe to our newsletter to receive regular updates on our work. 

A version of this article was first published before CoP27 in Egypt in 2022. It was updated for CoP28 in November 2023.

MapAction looking for volunteers to unlock information management barriers in humanitarian sector

MapAction is looking to fill six new volunteer positions with candidates who have the right skills to support work in the following fields: geospatial, development of geospatial training content, data science, data visualisation, software development and data engineering. Help MapAction and the humanitarian sector mitigate climate change and health emergencies through innovative use of software, geospatial technology and training, visualisations and data solutions.

Every day we hear news of how climate change is having devastating consequences for communities worldwide. As the effects become more clear and prominent – floods, droughts, hurricanes and natural disasters  – it is easy to feel helpless before the mitigation task at hand. 

At MapAction we are working to strengthen early warning systems, anticipatory humanitarian action, so that communities exposed to climate change and health emergencies can be more prepared and resilient. 

Frontline communities affected by a health or climate emergency depend on humanitarian agencies getting decisions right. These decisions, in turn, depend on good use of data. 

At MapAction, we are always looking for innovators who can bring their skills and experience to create data solutions that can support saving lives in humanitarian disasters. That is why we are inviting a software developer who can unlock information management barriers with innovative data solutions, a data engineer who can unlock devops challenges and review data and code hygiene issues, as well as a data scientist who can design innovative data-delivery breakthroughs for humanitarian agencies and partners. The geospatial volunteers will help us to continue to place the benefits of mapping and geospatial analysis at the service of humanitarians. 

Data scientist and data visualiser

The data scientist performs statistical analysis of geospatial data and helps us create data visualisations and dashboards. They review literature, collaborate with partners and help design and provide internal and external training. The data visualiser, on the other hand, will maintain the highest standards for visual communication, produce and test reports and dashboards, as well as charts and infographics. Each of these roles will work closely with the others. 

IN IMAGES: MapAction conducts simulated volcanic eruption response exercise on Isle of Cumbrae

Each role, however, is designed to streamline the work MapAction does: delivering a more efficient and data-driven humanitarian operations field, to support decision-makers in getting it right, so that lives are not needlessly lost or negatively affected. For a data engineer this might mean running a prototype environment to review how MapAction integrates software projects alongside mapping/data projects. It might mean cleaning script redevelopment – code hygiene – or deploying source controlled python scripts into a project workspace. For a data scientist, it might mean working with a software engineer or a specific disaster model or a tool to support early warning or relief decisions. Data and software engineers will also review coding standards and guidelines. 

Geospatial specialists

For a geospatial volunteer, it might be one map that opens up a huge aid solution or unlocks critical early funding for a CSO or humanitarian resilience network. In 2023 alone, our geospatial volunteers have responded to major crises alongside the UN in Turkiye, Libya, Kosovo and Peru. As a geospatial training content developer, you might engage in any number of activities: from providing support to CSOs in Southeast Asia or Southern Africa, to working with regional partners like the Caribbean Disaster Emergency Management Agency (CDEMA) or developing simulation for specific disasters, such as hurricanes. 

Many of these roles will entail opportunities to travel and work with some of the world’s leading humanitarian organisations: from the UN, WHO or WFP, to regional disaster response coordinators in four continents. 

READ ALSO: MapAction disaster mapping volunteers supporting UN on response to floods in Libya

Working closely with MapAction’s inhouse tech and geospatial departments – which include software engineers and data scientists –  as well as the UN’s Centre for Humanitarian Data in the Hague and other global partners, whoever fills these roles will get the opportunity to develop software, maps, training programmes, visualisations and data solutions that will broadly impact the humanitarian sector, as well as regional and national disaster relief agencies. These will pave the way for long-term impact and resilience. Working closely with national disaster agencies through the Start Network and INFORM, our innovation and tech team review national disaster models and preparedness worldwide, with a frontrow seat to enact sustainable change.

It is an opportunity for people with the right tech skills to see how the wider humanitarian system operates from the inside and where data and geospatial solutions play a role:  a front row seat to understand global trends and pressures driving world events and their consequences on people

Volunteers also provide vital support to UN agencies and other partners in emergency operations centres worldwide, both in-person and remotely. MapAction has been involved in more than 140 emergency responses worldwide in the last 20 years. 


Like what you’ve read and want to get involved? Please click here to see the full list of roles and to apply.

This work is made possible with funds from USAID’s Bureau of Humanitarian Assistance (BHA)

How maps helped the response to the Haiti earthquake

MapAction volunteer Chris Jarvis and a colleague from the Americas Support Team.

MapAction has been involved in the response to the earthquake that took place in Haiti on 14 August, helping our partners with data processing, analysis and mapping. This has helped those coordinating operational teams to understand what types of aid are needed in different locations and what other organisations are already doing to help. At the time of writing, this work is ongoing.

At the end of August, we scaled up our support to the UN Disaster Assessment & Coordination (UNDAC) and other responding organisations. Two MapAction volunteers traveled to Haiti to provide in-person assistance, supported remotely by our wider team. As well as using their annual leave to do this, both were required to self-isolate for 10 days after returning to the UK, in accordance with COVID rules. We are grateful to them both for their invaluable efforts.

This StoryMap looks at some of the maps that have so far been created during the response to the earthquake and how they have been used to help the situation on the ground.

Using data engineering to save lives

By Egor Zverev
Egor is working with us temporarily through Google’s Summer of Code programme.

How could I apply my programming and data science skills to make the world a better and safer place? I’ve been struggling to figure that out for quite some time, and finally after three years of studying computer science at MIPT in Moscow, I found an opportunity to fulfil my dreams. 

Hi, I’m Egor, and I want to write about the impact I am making while working on my Google Summer of Code (GSoC) project at MapAction!

I decided to join the GSoC programme as I felt it was an amazing opportunity to spend my summer working on a real-world open-source project. The programme offered me 202 organisations and over a thousand projects to choose from, but MapAction stood out as the only humanitarian organisation among them, so the choice was obvious to me. I faced some stiff competition as 25 other candidates applied for this role, so I am so grateful for the opportunity to join MapAction in its mission.

My GSoC began with a bonding period, and even that was amazing! I was introduced to MapAction during one of its many training days. I listened to various lectures given by the MapAction team. I was especially inspired by Hannah’s presentation as she is working at both MapAction and UN OCHA (the UN Office for the Coordination of Humanitarian Affairs) where she’s developing an anticipatory action framework. Talking to her was a fascinating part of my GSoC experience as it made me think hard about how I could help solve some of  the world’s problems. Following that, I had a week of meeting various people from MapAction. Each encounter was special in its own way. After my first week, I already felt like I was a part of the team, an ideal time to start coding.

I have been working on the data pipeline project: a MapAction tool to automate the acquisition and transformation of data. During the early stages of emergency response, it’s crucial to gather all necessary data as quickly as possible. My goal was to extend the pipeline from three to 22 data products. This will allow for visualisation of much more infrastructure and landscape features etc. After adding the initial five products, I realised that the code required a serious refactoring as it was quite unwieldy and difficult to deal with. During the first stage I managed to fix many local problems and reduced the total amount of code by almost 30%. Going forward, I am planning to redesign the entire pipeline’s architecture and implement a new design. After this I hope to add unit tests to ensure the code is correct. 

As most of MapAction’s developers are volunteers who only work for a couple of hours per week, a simplified pipeline will make it much easier for both them and any newcomers to make sense of it and use it. My work has also increased the readability of the code and made future pipeline development much faster. 

In summary, not only have I already added many valuable datasets to the pipeline that will allow MapAction volunteers to easily understand the locations of rivers, airports, country boundaries, etc. I am also bringing fundamental changes to the project that will make the life of MapAction’s volunteers much easier. I feel very proud of the impact I am making and it is an honour for me to spend my summer working on this project.

Training Caribbean disaster managers

We are proud to be supporting the delivery of an online course in crisis mapping in the Caribbean this month. The training course will involve around 50 disaster management professionals from across the Caribbean and is in partnership with the Caribbean Disaster Emergency Management Agency (CDEMA), with input from the Humanitarian OpenStreetMap Team (HOT). 

This is the second time the online course has been run, and we used our extensive deployment and training experience in the design and development of it.

Screenshot of GeoCRIS
Screenshot of the GeoCRIS showing a map of part of Western Haiti with several map layers selected

As well as learning the principles of disaster mapping for response and resilience and OpenStreetMap data entry, the participants are practicing effective use of the GeoCRIS. This is the new regional repository for geospatial data needed for risk and hazard mapping, disaster preparedness and response operations. As MapAction was involved in setting up the GeoCRIS, we are well placed to design and deliver this training.

The month-long course also includes a disaster simulation exercise in which the students will have the opportunity to deploy their newly acquired skills in a realistic emergency scenario. Additionally, two members of MapAction’s Caribbean volunteer team who have both recently been involved in the response to the La Soufrière volcanic eruption will be running a live session to share their real-world experiences of emergency mapping in the region and answer questions.

We’re grateful to USAID’s Bureau for Humanitarian Assistance (BHA) for funding this activity as part of our ongoing programme to improve the ways in which geographical information systems (GIS), mapping and spatial analysis are used in humanitarian emergencies.

Moonshot part 2: the slow data scramble

By Juan Duarte, MapAction Technical Director

When MapAction triggers an emergency response, the first step is for a team of staff and volunteers to begin what is known as a “data scramble”. This is the process of gathering, organising, checking, and preparing the data required to make the first core maps that emergency response teams will need, which will also be used as the basis for subsequent situational mapping.

Traditionally, the aim was to complete this data collection as quickly as possible, to get as much data as possible that was relevant to the emergency. However, due to the time-sensitive nature of this work, the team is often unable to dissect in detail the different data source options, processes, and decisions involved as they ready the data for ingestion into maps.

What if they weren’t constrained by time during the data scramble? What if they could deconstruct the procedure and examine the data source selection, scrutinise the processing applied to every data type, and explore the ways that these steps could be automated? To answer these questions, the volunteers at MapAction, with support from the German Federal Foreign Office, have been tackling a stepping-stone project leading towards automation, dubbed the “slow data scramble”. We called it this because it is a methodical and meticulous deconstruction of a rapid data scramble as carried out in a sudden-onset emergency.

Data gaps

As part of our Moonshot, MapAction is looking to automate the creation of nine core maps that are needed in every response, freeing up vital time for volunteers during an emergency, and, perhaps more importantly, identifying data issues and gaps well before the onset of an emergency. Towards this end, we have just released version 1.1 of our software MapChef, which takes processed data and uses it to automatically create a map. However, even with MapChef up and running, there is still a large gap in our pipeline: how do you get the data in the first place? How do you make sure it’s in the right state to go into the map? And which data do you actually need?

The volunteer team created and led a project intended to answer precisely the above questions, with the goal of scoping out the pipeline. This would include writing the code for completing the above operations, although not yet packaging things together in a smooth way – that is saved for a future pipeline project.

Selecting the right components

The first step was to determine what data is required to produce the core maps. The volunteers identified a list of 23 ingredients that make up these maps, which we call “data requirements”. These range from administrative boundaries to roads, and from airports to hillshading (a technique for creating relief maps). To complicate matters, each data artefact had multiple possible sources. For example, administrative boundaries could come from the Common Operational Datasets (CODs, distributed by the Humanitarian Data Exchange), the Database of Global Administrative Areas (GADM), or geoBoundaries

“The scale and extent of data available for just a single country administrative area alone is staggering.”

James Wharfe, MapAction volunteer

Next, the team needed to address how to obtain the data and ready it for further processing. Normally, when volunteers make maps by hand, they go to the website associated with each artefact, manually download it, and tweak it by hand until it is ready to be used in a map. However, with the pipeline this all needs to be automated. 

To approach this considerable undertaking, the team divided up the work into small, digestible tasks, meeting fortnightly to discuss progress, answer each other’s questions, and assign new tasks. This work continued diligently for seven months, at the end of which they had a functional and documented set of code snippets capable of automatically downloading and transforming the data required for all artefacts. 

Overcoming challenges

There were numerous challenges along the way that the team needed to overcome. Understanding the differences between the various data sources proved a significant hurdle. “The scale and extent of data available for just a single country administrative area alone is staggering,” noted volunteer James Wharfe. (Indeed, this data landscape is so complex that it merits its own post – stay tuned for a blog about administrative boundaries as part of our upcoming “Challenges of…” series.)

One particular data source that seemed to crop up everywhere was OpenStreetMap (OSM). Almost all of the data requirements in the slow data scramble are available from OSM, making it a key data source. However, given the sheer detail and size of the OSM database – 1,37 terabytes as of 1 Feb, 2021(source) – there are several difficulties involved when working with the data.

For the download step, the team decided to invoke the Overpass API, and create a Python method to abstract the complex query language down to some simple YAML files with OSM tag lists. Next, the downloaded data needed to be converted from the OSM-specific PBF format to a shapefile, which is the type of data expected by MapChef. Several solutions for this exist: to name a few, Imposm, PyDriosm, Osmosis, OSM Export Tool, and Esy OSM PBF. For this project, we decided to use GDAL, however, we certainly plan on exploring the other options, and hope to eventually host our own planet file. 

Code control

Even though the goal of the slow data scramble was not to produce production-quality code, the team still used Git to host their version-controlled code. According to Steve Penson, the volunteer leading the project, “The collaborative and explorative nature of the project meant Git was incredibly useful. With each volunteer tackling significantly different challenges, establishing a strong code control setup made our weekly reviews far easier.”

The team also used the opportunity to extend their Python skills, with a particular focus on GeoPandas, which enables some of the more intricate data transformations that are normally performed by mainstream desktop GIS tools. 

Additionally, the group used this work to explore the concept of DAGs, directed acyclical graphs.  This term refers to the building blocks of any pipeline: a recipe, or series of steps, that you apply to your data. There are scores of packages available to assist with pipeline development, but to start, the team decided to use a simple workflow management system called Snakemake. Snakemake works by using Makefiles to connect the expected input and output files across multiple pipeline stages. Although, in the end, the team decided it was not the best solution for scaling up to the real pipeline (which is now being developed with Airflow), they agreed that using Snakemake was a great stepping stone to becoming familiar with this key concept. 

Working together

Finally, before COVID-19 hit, MapAction’s dedicated volunteers were accustomed to meeting in person once a month – a commitment that led to many enjoyable shared moments and close friendships. This positive and much-loved aspect of being a volunteer at MapAction has unfortunately been hindered by the pandemic. Although still conducted fully remotely, the slow data scramble offered the chance to regularly meet, share expertise, motivate and encourage each other, and work together. Volunteer Dominic Greenslade said it well:  “MapAction volunteers are amazing people, and the ability to spend so much time getting to further these friendships was a great bonus”.

MapAction selected for Google Summer of Code

MapAction has been chosen as one of 202 organisations taking part in Google’s 2021 Summer of Code, a global programme that aims to bring student developers into open source software development. As part of the scheme, which has now entered into its 17th year, students can apply for placement projects from 202 open source entities, with their time paid for by Google. MapAction is one of 31 organisations taking part for the first time.

Since launching, over 16,000 students across 111 countries have taken part by working with an open source organisation on a 10-week programming project during their summer break from studies. Google Summer of Code is open to students who are age 18 and older and enrolled in a post-secondary academic programme in most countries. As MapAction is one of the only companies taking part from the humanitarian charity sector, it’s a great opportunity to highlight the importance of technology advances to our work.

As part of our Moonshot initiative, two students will be helping us with our goal of automating the production of core maps needed in any humanitarian crisis, for 20 priority countries. Being able to automate these maps means essential contextual and reference information about, among other things, the local environment, population and infrastructure, is immediately available when needed in the best possible quality. The students will be working with MapChef, our Python-based map automation tool, and our MVP pipeline framework for automated data acquisition and processing. As our capability grows, we intend to use these systems to identify data gaps at regional levels.

Diagram showing 3 map layers floating on top of each other: base map, baseline and situational

Take a look at our project ideas for the Google Summer of Code. Applications officially open on 29 March and we anticipate a lot of interest.

MapAction contributes to new health emergencies handbook

In Control hardback book

Over 50 authors, including two MapAction team members, have contributed their expertise and insight about working in health emergencies to a new handbook for humanitarian professionals.

Spearheaded by the Robert Koch Institute, In Control: A Practical Handbook for Professionals Working in Health Emergencies Internationally is aimed at preparing and supporting those deploying internationally during humanitarian crises.

Addressing the multi-faceted challenges of an international deployment, the book provides technical medical information as well as insights into the challenging environments volunteers often work in and the cultural differences that influence risk communication.

The book is divided into two halves, with the first providing an overview of the international architecture and inter-disciplinary environment within which health emergency responses occur. These include the organisations, principles, frameworks and themes that every health professional deploying aboard should be aware of. The second half of the book provides practical advice to help professionals survive and thrive during their mission. Chapters include how to prepare for a deployment, such as arrangements that should be taken care of ahead of departure, and suggestions on what to pack.

Infographic: coordinate system; units; source; triangulate; absent values; restrictions; date
Checks to incoming data can easily be remembered
using the acronym CUSTARD.

Information management & visualisation

As part of their contribution (in chapter 3, starting at page 200), MapAction’s Matt Sims and Alan Mills shared how important data visualisations are in making well-informed decisions and the importance of identifying information gaps to ensure those who may need assistance are not overlooked.

Also covered in their chapter are the questions that responders should be asking themselves when handling data, such as whether it identifies the location of vulnerable individuals or groups; how the data is stored and protected; and what will be produced from the data, among other considerations.  

Hard copies of the book can be requested by emailing the Robert Koch Institut.

Ten tips for making simple, informative maps in a pandemic

MapAction has been collaborating for a number of years with French NGO and fellow humanitarian information management specialists CartONG.

Four people participating in an online meeting, two from MapAction, two from CartONG

In addition to our operational activities, we thought it would be worthwhile to pool our collective knowledge to create an informative article. The ten-minute read aims to give some helpful tips for people creating maps intended to assist humanitarian responses to the Corona virus and other pandemics.

Between us, we have a lot of experience of using geospatial analysis and visualisations to inform decision-making in this and previous epidemics, such as Ebola, as well as the current pandemic. We wanted to share this knowledge more widely and felt that, by working together, we could create something really useful and reach more people. Although it was written with pandemics in mind, many of the points apply to all kinds of map making.

You can read the article on the CartONG blog below.

AFD, H2H Network and UK aid logos

This project was co-funded by the French Development Agency (AFD) and the H2H Network’s H2H Fund, the latter supported by UK aid from the UK government.

MapAction’s Moonshot – origins and ambitions

By Juan Duarte, Technical Director, and Monica Turner, Data Scientist, MapAction

Close up of left hand side of the moon
Photo: Adam Scott

History will always underscore how landing on the moon represented a significant milestone in the space race, yet what is often less spoken about is the number of technologies that might not have ever made it without space travel.

These include the all-important ability to take pictures on our phone, thanks to the technology originally created by a team at the Jet Propulsion Laboratory, and the technique used to develop diamond-hard coatings for aerospace systems that can now be found on scratch-resistant spectacles. Inventions that originally started life with a bigger purpose but have filtered down into solving some of the challenges in our everyday lives.

This brings us onto MapAction’s own Moonshot initiative – an ambitious programme of work encompassing step changes in the way we use different technologies in the course of our work. This includes things like how we triage, assign and manage the requests for support we receive, and how we can automate certain repeat activities. 

One of the first projects we are working on within the Moonshot programme will enable us to produce seven to nine key maps for 20 of the world’s most vulnerable countries automatically, using technology we’re developing that will provide benefits for many years to come. This is being funded through our partnership with the German Federal Foreign Office.

In the humanitarian sector, a perennial challenge is access to high-quality data. This need is even more acute in the chaotic aftermath of a humanitarian emergency, when data and maps are crucial to make rapid sense of the situation and plan the best response to save lives and minimise suffering. 

In the early hours of a crisis, one of the first tasks facing our team is to produce standardised ‘core’ maps that will be used throughout the response, regardless of the nature of the emergency. These provide contextual and reference information about, among other things, the local environment, population and infrastructure. Sometimes they are created under difficult on-the-ground conditions or with incomplete information. Once they are in place, they are used to create additional situation-specific maps by layering on top evolving information about the extent and impacts of the emergency and the humanitarian response.

As MapAction has made maps in hundreds of emergencies, it has become apparent that, in creating these foundational core maps, there are many repeatable, generalised tasks that could be handled much more quickly by a machine, achieving in seconds what used to take hours. This would give humanitarian decision-makers the orientation information they need immediately, and free up our specialist volunteers for actively assessing and engaging with the situation at hand and performing the mapping tasks that only humans can do. 

Moreover, by shifting the focus from reactive to proactive data sourcing and map production, we can ensure we provide the best maps possible – not just the best maps, given the time and data available and the prevailing circumstances in the midst of a humanitarian emergency. 

Many countries, particularly low and middle-income countries, are likely to have data gaps, and they are often also the countries that may have the least resilience to emergencies such as droughts or earthquakes. Identifying and addressing these data gaps in advance is a big part of the Moonshot project, and something that will have benefits for the humanitarian sector as a whole. 

Like the proverbial needle in the haystack, important data can exist within a subset of a much larger dataset and accessing it can be tricky. Finding a gap is even more difficult, as you’re looking for an unknown entity that isn’t there. The technology we’re developing for the Moonshot will help us to identify the hard-to-see data gaps and quality issues that currently exist. By discovering these, we can pinpoint what information will be needed to ensure a complete map and then work with partners around the world to proactively put in place missing data or improve what currently exists. 

The initial goal of the Moonshot is to publish 180 core maps (nine for each of the 20 vulnerable countries identified at the beginning of the project). The same processes will then be applied to other countries and, eventually, to other types of automated maps beyond these core ones. This means we will ultimately be in a position to expand our understanding and quality assessment processes for more data types. New opportunities and routes of travel are likely to emerge as the project develops.

The ambition is big, but the possibilities that will result from achieving this goal will fundamentally change the way we approach map creation in the humanitarian sector in the future.

In a series of blogs over the next few months, we will share the story of this work as it unfolds, as well as diving down deeper into specific elements of it.

Supporting refugees in Northwest Syria

Earlier this year, MapAction was asked by the UN’s Office for the Coordination of Humanitarian Affairs (OCHA) to send a team to Turkey. Their mission was to provide assistance to humanitarian teams there and in Northwest Syria who are supporting the very large numbers of refugees and internally displaced people that arrived in the region during the first three months of the year following an upsurge of fighting in Aleppo.

The request was to work with two groups of organisations collaborating to collectively manage around 900 refugee camps; the Camp Coordination and Camp Management (CCCM) Cluster, and the Shelter /Non-Food Item (SNFI) Cluster.

Days before the MapAction team was due to travel, the UK and Turkey went into lockdown. Consequently, the team was compelled to switch rapidly to a remote-working approach.

Since late March, they have been helping the Clusters to get a better understanding of the locations and sizes of the camps and the needs of the people arriving and living in them. Camps vary enormously; from just a few tents to up to 93 separate sites within a single camp, and from long-term, static settlements to temporary ones.

As well as cross referencing, checking and cleaning data about camp locations received from numerous sources, the MapAction team developed some simple tools to help do this quickly and easily in future, which will also have benefits for other areas of work undertaken by the Clusters. One tool validates the location coordinates of camps recorded by teams within Syria, another matches them to Syrian administrative areas.

The MapAction team has also been locating aerial images of the camps on OpenStreetMap and using these to develop 900 map polygons showing the shape and size of each camp. As well as helping the Clusters to understand and meet the existing needs of people in the camps, this work will help to inform them about their population densities, which is particularly important in the context of COVID-19.

Updated to add: This project was shortlisted for a DataIQ Award for ‘Best use of data by a not-for-profit’.

Helping WHO with mapping in Libya and Chad

MapAction volunteers have been supporting the World Health Organization (WHO) in Libya and Chad to process and map data about health and sanitation services, in order to support the response to COVID-19.

The volunteers have been working remotely, alongside each country’s health cluster (networks of WHO partners that work together to relieve suffering and save lives in humanitarian emergencies). They have been helping to identify and map what healthcare, water and sanitation services and aid are being provided, by whom, when and where. This is known as 4W mapping and is important to help identify gaps and avoid duplication.

We are now looking at providing similar assistance to WHO in other parts of North and Central Africa.

COVID-19 government measures dashboard

We’ve helped ACAPS to put together a dashboard showing government measures being taken around the world. Data can be filtered by region, country, type of measure and timeframe.

Screenshot of government measures dashboard

We will be updating this twice a week. In the meantime ACAPS, MapAction and other organisations are looking at further topics to develop analysis for. 

Sharing insights at INSARAG meetings in Chile

This week, a MapAction volunteer has been participating in discussions and strengthening relationships with our partners at the International Search and Rescue Advisory Group (INSARAG) Information Management Working Group and Team Leaders meetings in Santiago, Chile. These conversations enable us to continuously improve how we visualise data collected by INSARAG teams.

Thanks to the USAID Office of U.S. Foreign Disaster Assistance for supporting our participation, as part of our joint programme to improve the ways in which geographical information systems (GIS), mapping and spatial analysis are used in humanitarian emergencies.