Please answer the brief multiple choice survey below to help us understand more about who is using our maps. We’ll use this data to improve the maps and services we offer you. Thank you.
Tag: maps
How maps helped the response to the Haiti earthquake
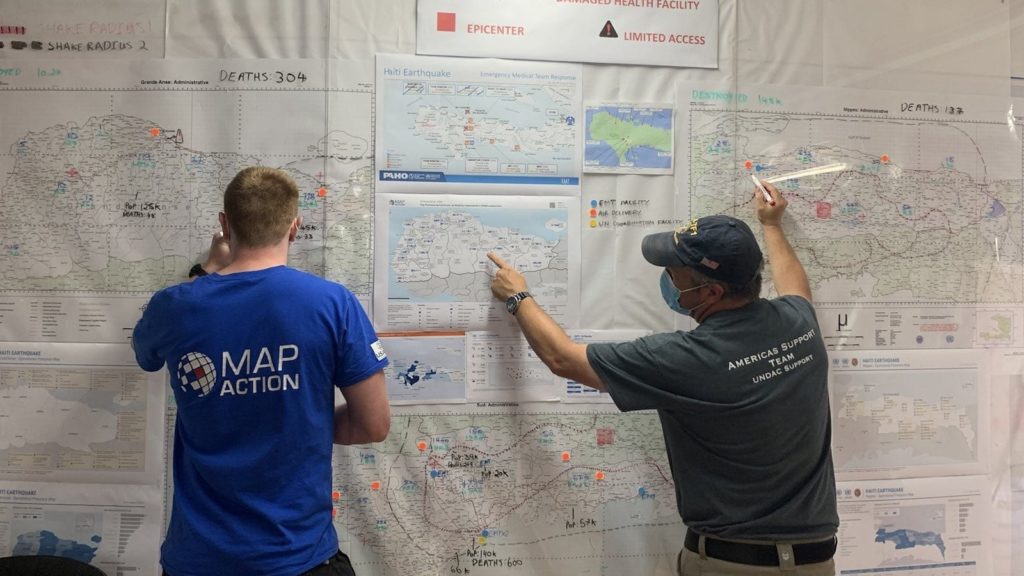
MapAction has been involved in the response to the earthquake that took place in Haiti on 14 August, helping our partners with data processing, analysis and mapping. This has helped those coordinating operational teams to understand what types of aid are needed in different locations and what other organisations are already doing to help. At the time of writing, this work is ongoing.
At the end of August, we scaled up our support to the UN Disaster Assessment & Coordination (UNDAC) and other responding organisations. Two MapAction volunteers traveled to Haiti to provide in-person assistance, supported remotely by our wider team. As well as using their annual leave to do this, both were required to self-isolate for 10 days after returning to the UK, in accordance with COVID rules. We are grateful to them both for their invaluable efforts.
This StoryMap looks at some of the maps that have so far been created during the response to the earthquake and how they have been used to help the situation on the ground.
Responding to the Volcanic Eruption in St Vincent and the Grenadines
By Lavern Ryan, MapAction volunteer.
“Alert Check: Volcanic Eruption St Vincent and the Grenadines, please sign up your availability.” Those were the words which greeted me as I checked my MapAction email. Simple words, but so profound for me. They really hit hard, and hit home! I could not ignore that call for action. I signed up for remote deployment. It turned out to be my first official response deployment as a MapActioner!
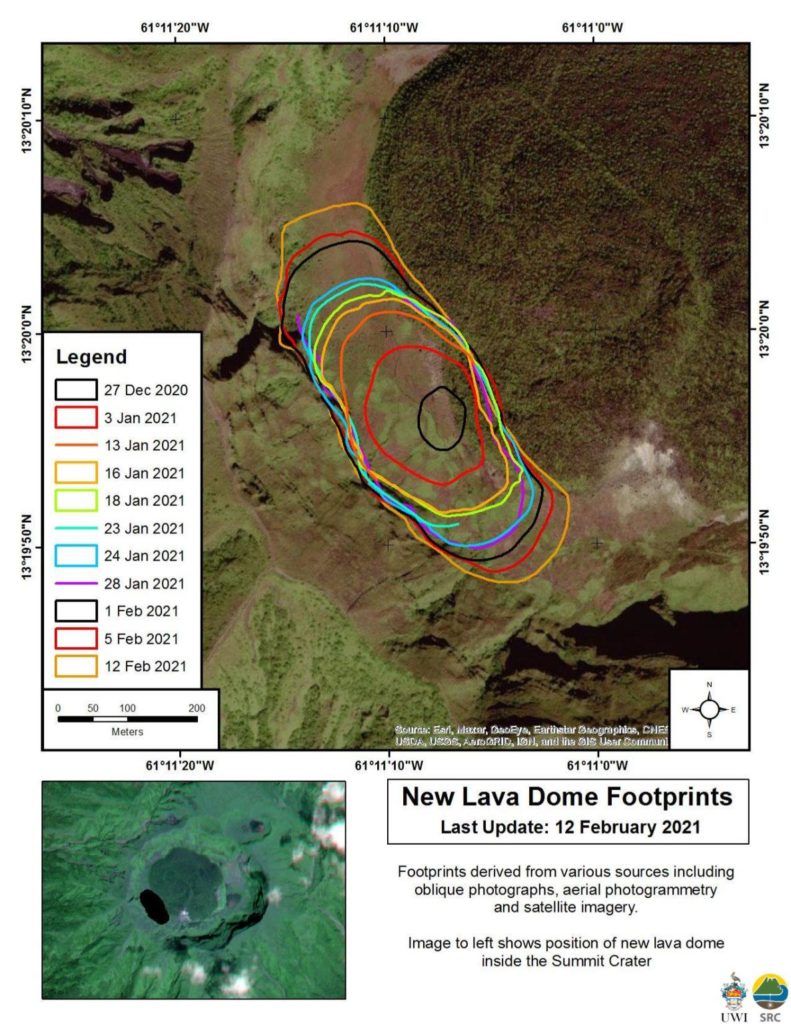
Like many people within the region, I have been observing the volcanic dome growth in St Vincent and the Grenadines since late 2020. As it grew, magma continued to fill the space around the old 1979 dome, as depicted in the images below.
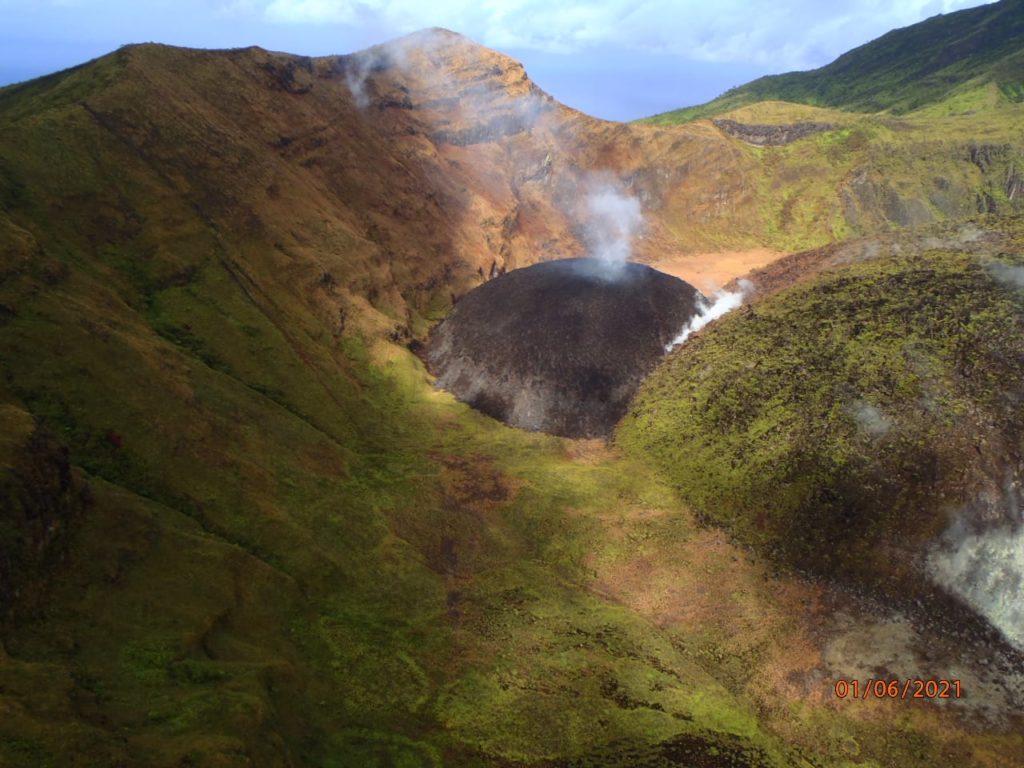
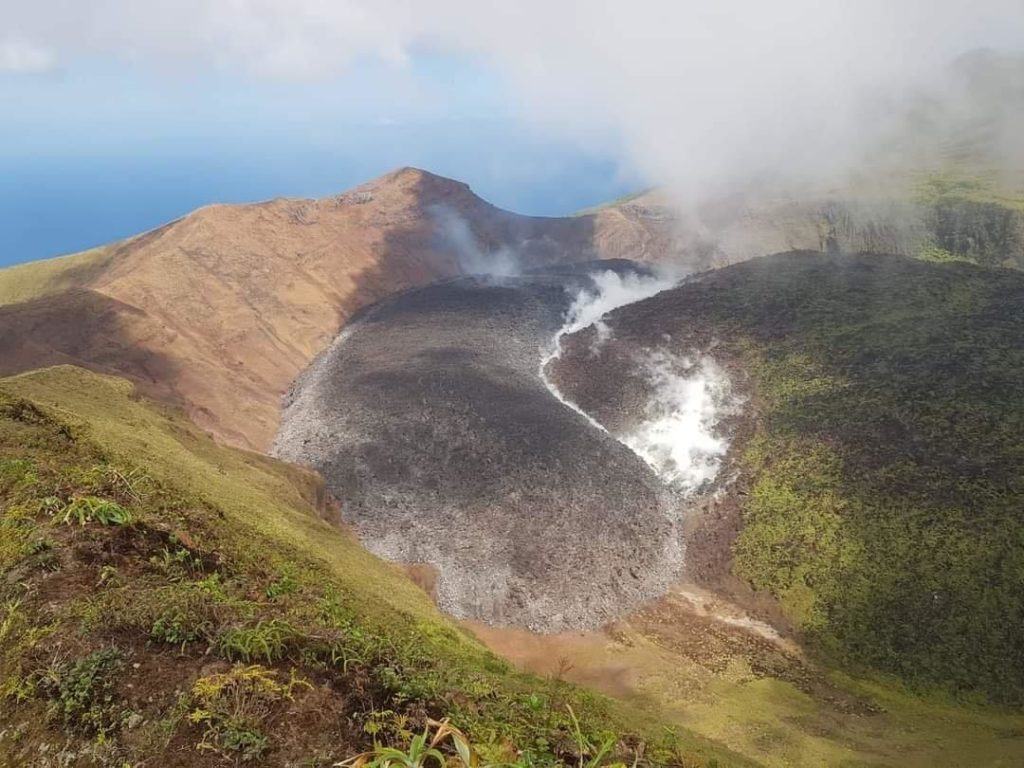
A period of elevated volcano-tectonic (VT) earthquakes, which began on 23rd March, 2021, indicated to scientists that the situation at La Soufrière had deteriorated. An evacuation order was issued on April 8, 2021 by Prime Minister Ralph Gonsalves.
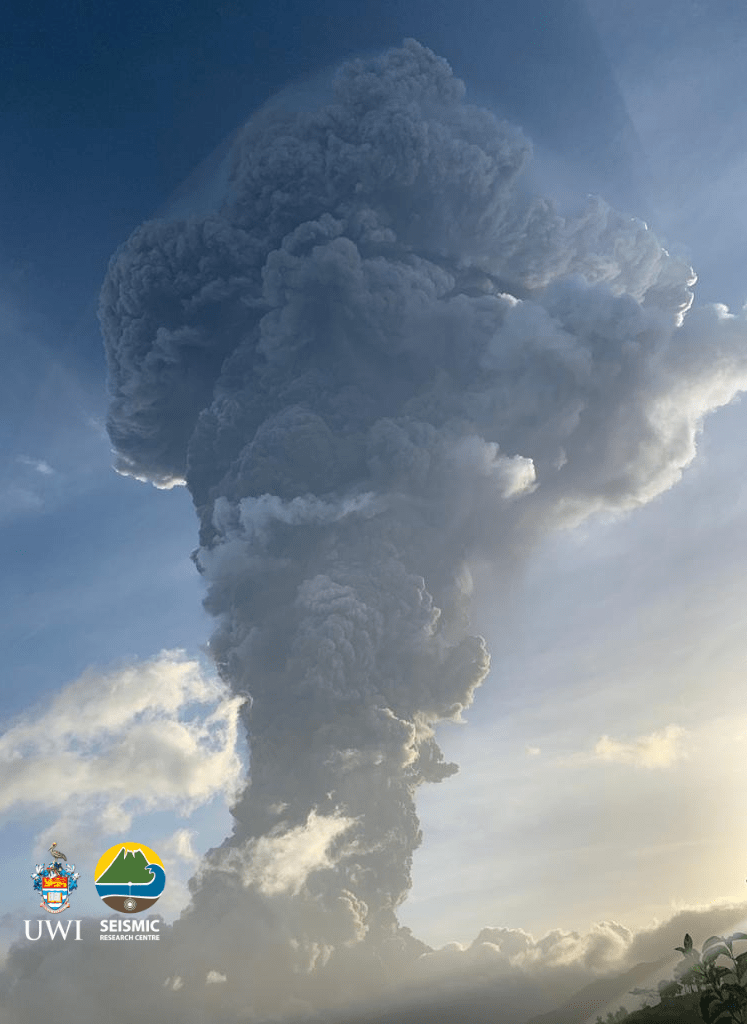
The very next day, on April 9, 2021, La Soufrière Volcano erupted! The eruption was very visible to people around the world due to the prominence of posts on social media. It was easy to see live feeds and video posts as the action unfolded. Images of the massive mushroom plume created by the eruption brought back so many memories for me. It was beautifully dangerous!
Having experienced the eruption of our very own Soufrière Hills Volcano in Montserrat and having lived with an active volcano for the past two decades, I empathised with the residents of St Vincent and the Grenadines. Being displaced from one’s home to live in a shelter is no easy feat. Having to leave behind the beloved island you call home is even more challenging. I knew the road ahead for many people would be long and difficult. Hence my conviction to help in the best way I knew: – by providing geospatial support.
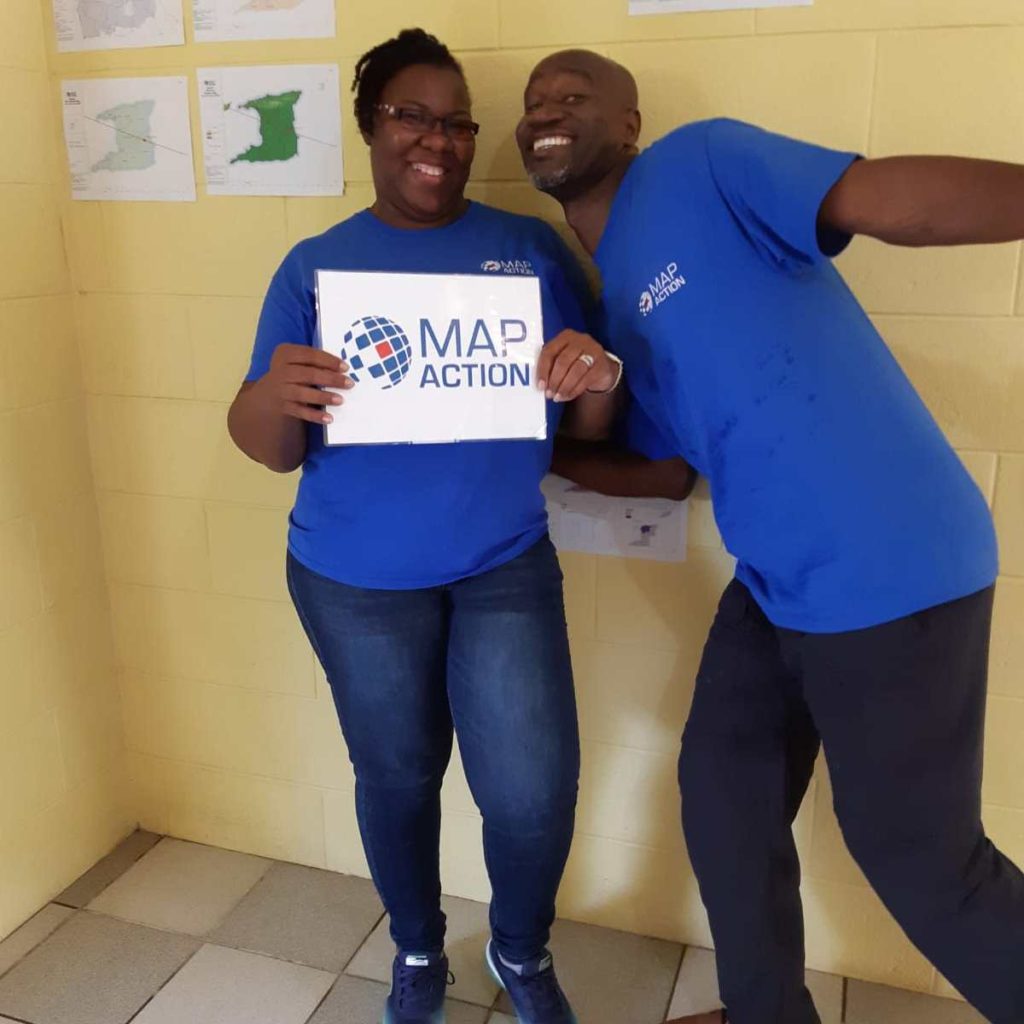
It was great news to discover that Mike was also selected as a member of this remote deployment team for the St. Vincent Response. Mike and I were recruited at the same time in 2019 to form part of the Caribbean Section of MapAction. The picture below is a throw-back to June 2019 in Trinidad. We had several days of intense conversion training sessions. In retrospect, those days really set the foundation for our ability to deliver during this response.
Our team was led by Matt who resides in New Zealand. He is very knowledgeable and has significant experience in deployments. We also received additional support from another volunteer, Pip, who is located in the UK. We supported the Caribbean Disaster Emergency Management Agency (CDEMA) for a period of three weeks. Subsequently, another two volunteers, Ant and Jorge, were deployed to support the environmental work of the United Nations Environment Programme’s (UNEP) response. We represented different time zones and locations from across the globe.
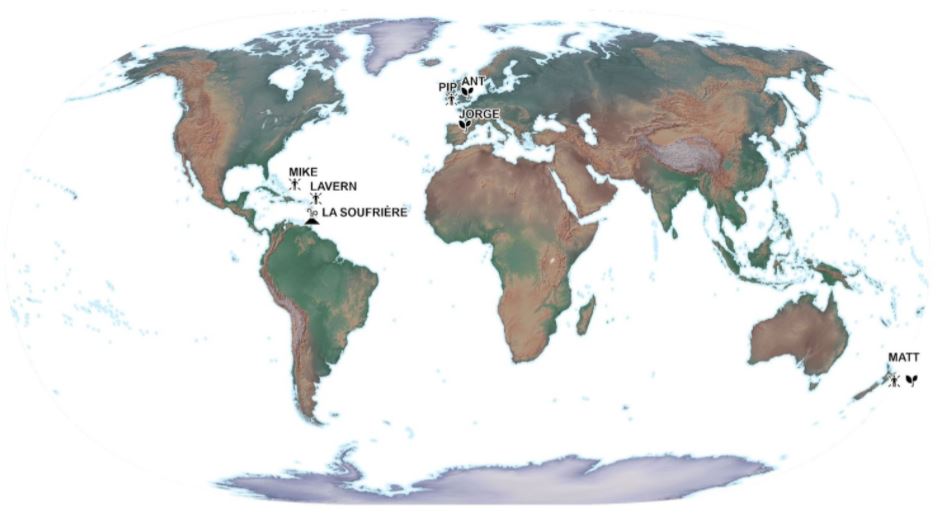
This unique team selection, worked out very well, as it offered 24 hour coverage for the St. Vincent response. Mike and I, being located in the Caribbean region, were uniquely placed to attend briefing meetings in our local time zone and follow up with any new developments; while Matt provided another level of support from New Zealand, as his day began when ours was coming to an end. No sleep lost – I guess! Our daily briefing meetings allowed us to report our findings during that day and to strategise the allocation and completion of tasks.
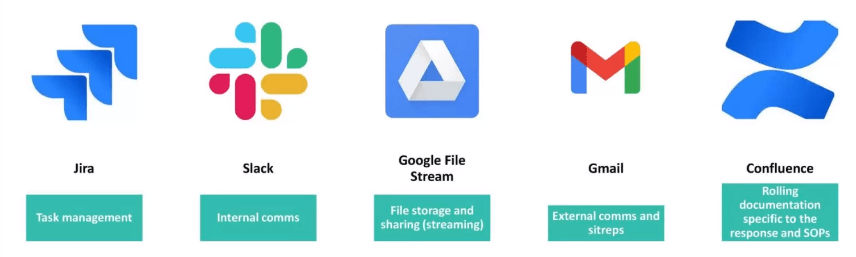
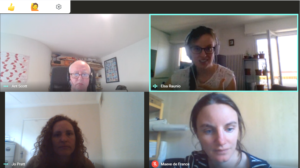
MapAction has mastered the ability to use different tools to share and work together in a remote working environment. In my opinion, the COVID-19 pandemic has only strengthened this area. The image below highlights some of the main tools we used to ensure smooth deployment coordination.
One of the major needs of any emergency response is geospatial data. The ‘data scramble‘ as the term is coined, involves the researching, collating and organising of all the spatial data available for a particular location, ensuring that it is fit for purpose. The data collected was prepared by transforming it into the correct projected coordinate system to allow for overlay and integration between different datasets. Datasets included administrative boundaries, such as parishes, census districts, shelter locations, elevation data, transportation networks, buildings, land use, hazard zones, and health centres, just to name a few. These were placed in appropriately themed folder locations so that it would be easy for deployed members to find them during the response.
Coordinating with CDEMA, MapAction provided mapping support to to aid in visualisation of the situation on the ground.
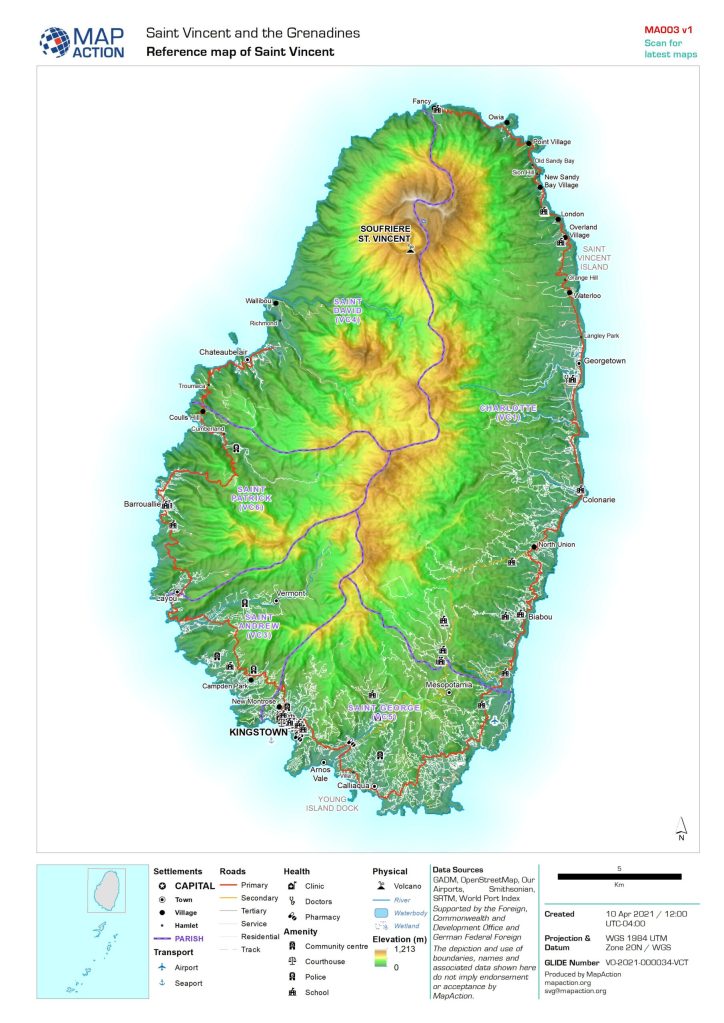
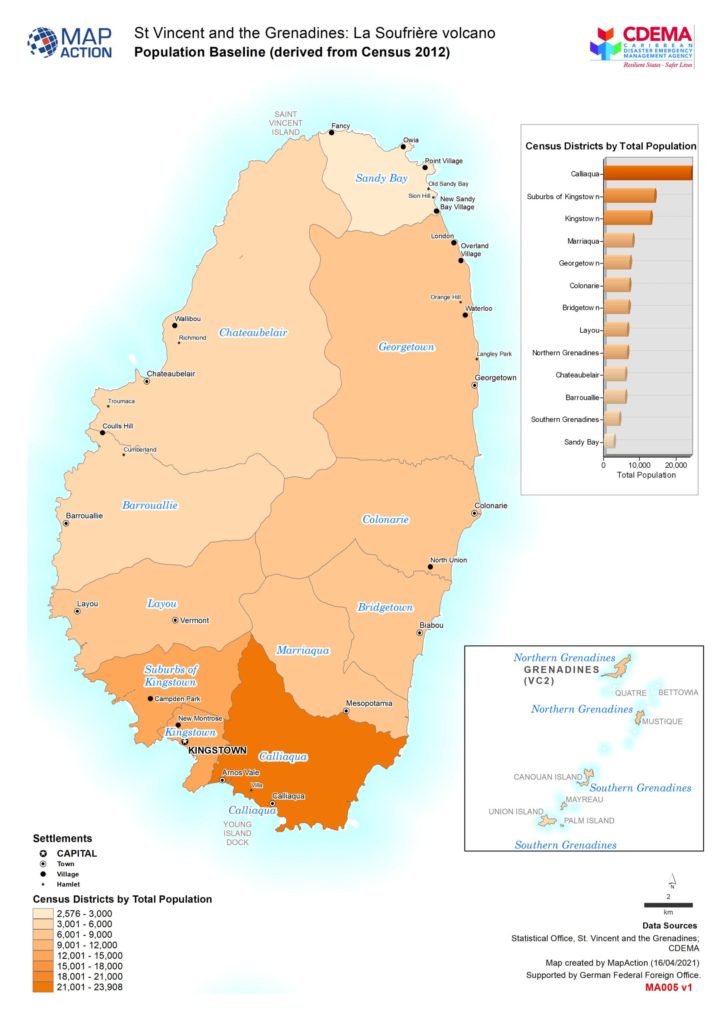
One of the first maps prepared is a reference map of the area. I consider this to be one of the most important maps to be prepared, as it gives context to the area of interest. Everything else is built upon this.
The basemap shown on the left below is detailed with settlement locations, roads, parishes, village names, rivers and elevation data. The baseline map sown on the right, highlights the population figures of St.Vincent derived from the most recent 2012 census survey. This allowed us to understand how the population is distributed throughout the affected areas.
To provide further understanding, situational maps were prepared. Data being shared through situation reports from the Emergency Management Agency allowed us to create visual representations of what was happening on the ground. The map on the left, shows movement of displaced people from affected communities in the red, orange and yellow zones. The map on the right shows the location and status of the shelters.
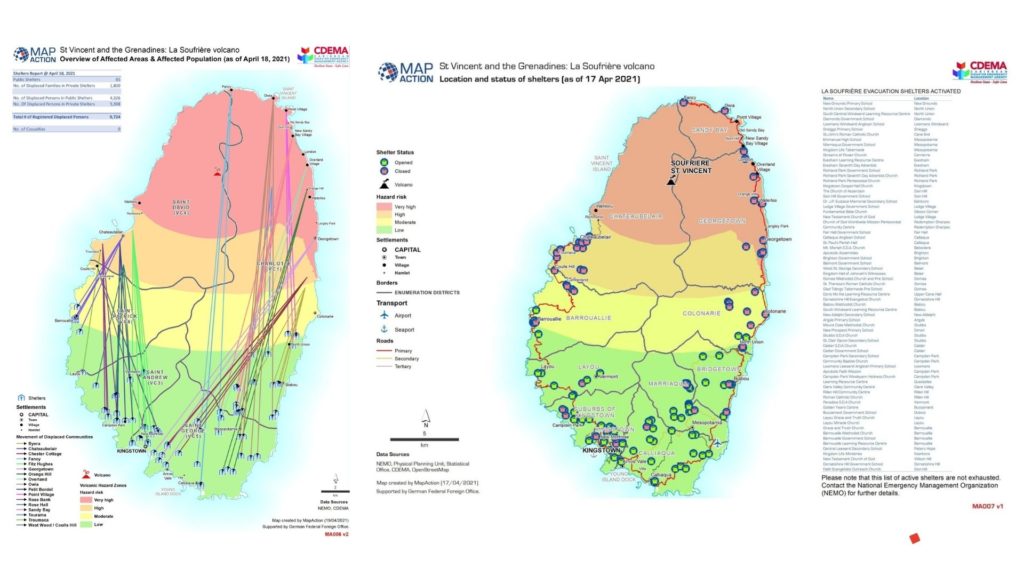
Additionally, a 3D webmap was created showing the key volcanic events and hazards of the La Soufrière volcano. This dynamic map allows you to explore the data which was used to create the maps above and offers a better understanding of the risk posed by the volcanic eruption in St. Vincent.

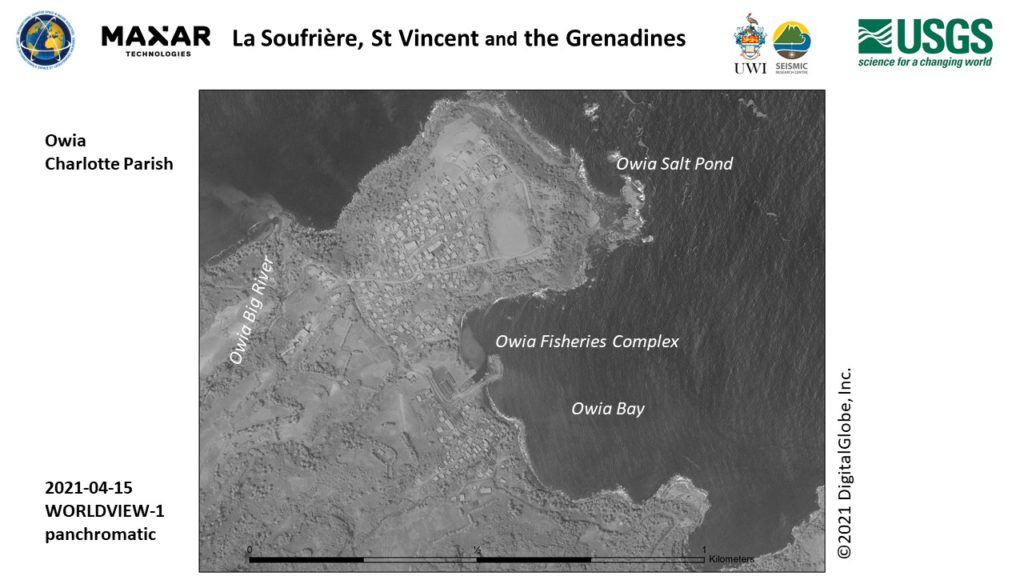
Working so closely with the data from St. Vincent during this period of time, allowed me to become very familiar with areas and village locations on the island. Seeing feeds on social media allowed me to identify quickly with where things were happening. Names such as as Chateaubelair, Troumaca, Byera, Owia and Fancy stood out to me!
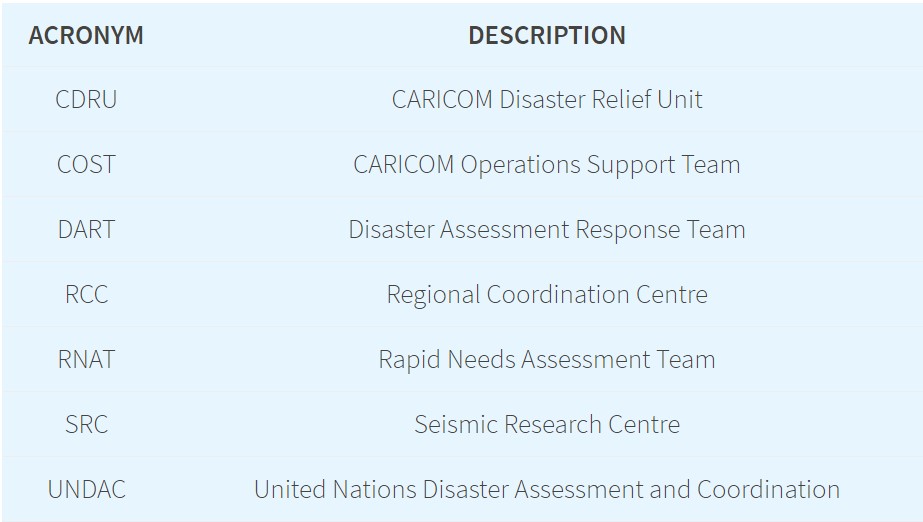
During my remote deployment, some acronyms were mentioned frequently during our briefing meetings. I eventually got the hang of them! These all form part of the response mechanism which helps the crisis on the ground to be addressed. Each of the teams highlighted below, played a very important function in being able to get supplies into St. Vincent, assessing the needs of the population and understanding the impact of the disaster on the island.
A number of other international organisations responded to the crisis in St Vincent and the Grenadines by activating their disaster response mechanisms and programmes. The links below provide additional insight into their response activities.
- Copernicus Emergency Management Service
- The International Charter Space and Major Disasters
- Maxar: Open Data Program
- Nasa Disaster Program
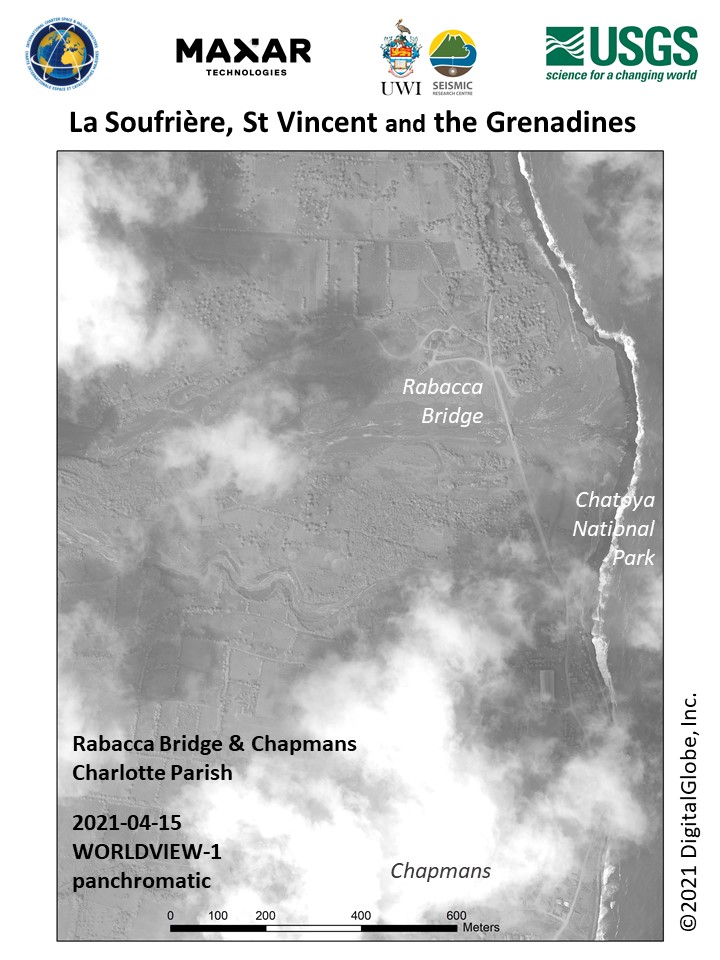
Satellite images like the ones below were captured as time progressed and further mapping and analysis was carried out. Derived information proved useful to responders on the ground.
MapAction is known to respond in-person during an emergency response deployment. Although the COVID-19 pandemic has limited this, my experience through this remote response deployment has shown that MapAction’s involvement is still significant in providing geospatial information to support the humanitarian needs of people in crisis. I do look forward to future deployments with MapAction!
This article was first published on Lavern’s own blog on 24 May 2021.
Interactive map shows violence and threats to health workers during COVID-19
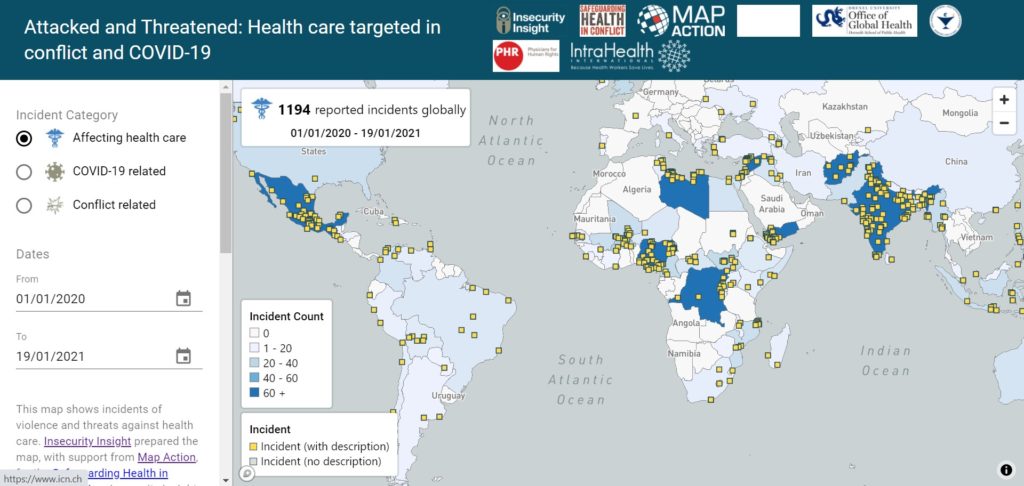
The increase in the number of security incidents affecting healthcare workers during the COVID-19 pandemic has been highlighted in an interactive web map launched today.
Incidents include the arson of COVID-19 testing facilities, the targeting of health workers on their way home from clinics, and violent responses to mask requirements.
Developed by Insecurity Insight, a non-profit which works to examine threats facing those living and working in dangerous environments, and MapAction, the user-friendly map is intended to support the aims of the Safeguarding Health In Conflict Coalition.
Christina Wille, Managing Director, Insecurity Insight, commented, “This tool gives stakeholders concerned with the protection of health care global insight into COVID-related incidents of threats and violence against health care providers to support better protection of health workers.”
The map depicts 412 acts of pandemic-related violence and threats to health workers and services around the world in 2020 out of a total of 1,172 incidents. Because not all incidents are reported or recorded, the actual number is likely to have been significantly higher.
To create the map, MapAction needed to consolidate the data available – which is often in indigestible formats and from multiple sources – understand the geographical context and visualise it. We brought our considerable experience in humanitarian mapping, information management, and solution design to the project, ensuring the information architecture is a stable platform that is easy to manage, while allowing for future adaptations and enhancements to be seamlessly integrated.
Christina continued, “We are working with MapAction to expand the map’s functionality and develop a similar tool for the education sector and other areas, as well as a map on security incidents affecting aid operations in Mozambique.”
View the press release here.
MapAction contributes to new health emergencies handbook
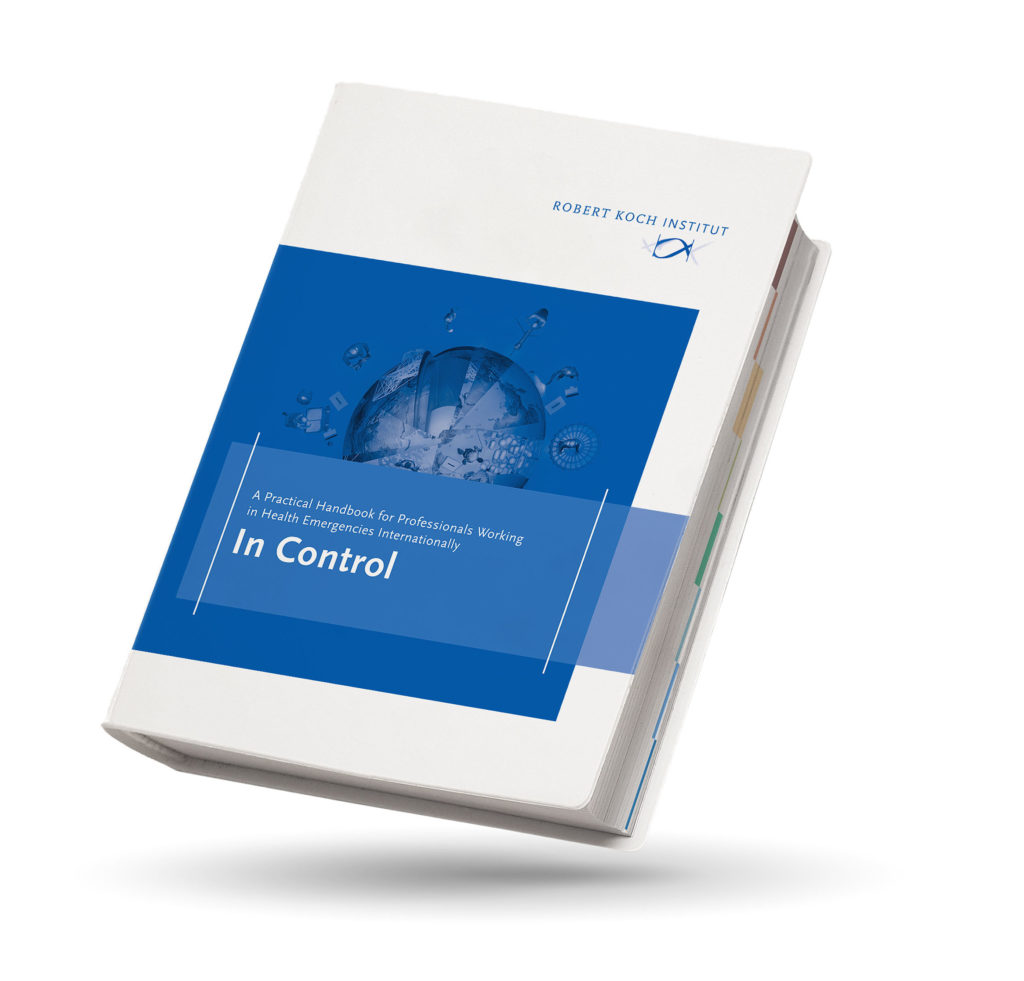
Over 50 authors, including two MapAction team members, have contributed their expertise and insight about working in health emergencies to a new handbook for humanitarian professionals.
Spearheaded by the Robert Koch Institute, In Control: A Practical Handbook for Professionals Working in Health Emergencies Internationally is aimed at preparing and supporting those deploying internationally during humanitarian crises.
Addressing the multi-faceted challenges of an international deployment, the book provides technical medical information as well as insights into the challenging environments volunteers often work in and the cultural differences that influence risk communication.
The book is divided into two halves, with the first providing an overview of the international architecture and inter-disciplinary environment within which health emergency responses occur. These include the organisations, principles, frameworks and themes that every health professional deploying aboard should be aware of. The second half of the book provides practical advice to help professionals survive and thrive during their mission. Chapters include how to prepare for a deployment, such as arrangements that should be taken care of ahead of departure, and suggestions on what to pack.
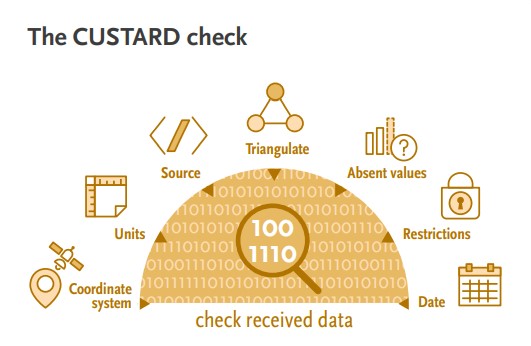
using the acronym CUSTARD.
Information management & visualisation
As part of their contribution (in chapter 3, starting at page 200), MapAction’s Matt Sims and Alan Mills shared how important data visualisations are in making well-informed decisions and the importance of identifying information gaps to ensure those who may need assistance are not overlooked.
Also covered in their chapter are the questions that responders should be asking themselves when handling data, such as whether it identifies the location of vulnerable individuals or groups; how the data is stored and protected; and what will be produced from the data, among other considerations.
Hard copies of the book can be requested by emailing the Robert Koch Institut.
MapAction’s 2020
This has been our busiest ever year. We asked people from across our team what their 2020 was like at MapAction. This is what they told us:
Mapping people who are moving
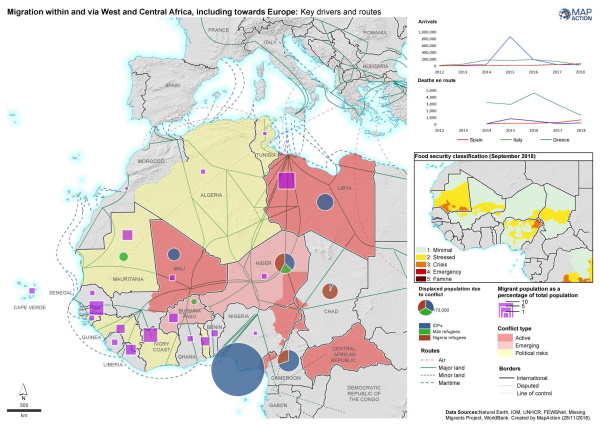
December 18 marks The United Nations (UN) International Migrants Day, recognising the efforts, contributions, and rights of migrants worldwide. In light of this, we decided to share some of the work we did this year during the Syria crisis to highlight some of the challenges of meeting the needs of migrant populations, and also explore the role that maps can play when people are displaced from their homes.
MapAction was asked by the UN’s Office for the Coordination of Humanitarian Affairs (UN OCHA) to send a team to Turkey. Their mission: to help humanitarian teams there and in Northwest Syria supporting almost one million people – 60% of them children – that arrived in the region during January-March 2020, following an upsurge of fighting in Aleppo.
A population displacement of this scale and speed results in great vulnerability for those involved, as well as many unknowns for humanitarians about people’s access to essential things like food, water, sanitation and shelter. And that’s before you factor in the added complication of COVID.
MapAction was asked to support two groups of humanitarian organisations collaborating to manage around 1,000 refugee camps – the Camp Coordination and Camp Management (CCCM) Cluster, and the Shelter /Non-Food Item (SNFI) Cluster.
Camps vary enormously, from just a few tents to the size of a small city, and from temporary to long-term settlements. Some are isolated, while others are grouped together. Getting clean, up-to-date data about them is essential for the Clusters to coordinate life-saving aid.
MapAction’s aim was to grant the Cluster coordinators a ‘single source of truth’ about the locations and sizes of the camps, to enable them to understand their population density and meet the needs of the people arriving and living in them. The imminent threat of COVID-19 made this even more urgent and important – not to mention more difficult.
‘Data cleaning’ is a vital part of the process. Camp data is often captured by collectors with varying levels of training, network connectivity and other obstacles. Sometimes geographical coordinates are estimated from a central location instead of using GPS, or transcribed manually, introducing human errors. The same data might be captured several times by different organisations, with different results. All of this can make it difficult to pinpoint the exact locations of camps and could cause them to be missed or double counted, resulting in delays or complete omissions in aid delivery.
Camps vary enormously, from just a few tents to the size of a small city, and from temporary to long-term settlements. Some are isolated, while others are grouped together. Getting clean, up-to-date data about them is essential for the Clusters to coordinate life-saving aid.
The MapAction team compared a core list of 700 sites against a further list of 600 camps, and used GIS analysis to deduplicate against location, site name and then visually against the latest satellite imagery, to confirm locations. Over three iterations, they were able to support the CCCM Cluster to improve the core list from 700 to around 1,000 sites.
To aid this process in Syria, our team created two data tools. One helped to identify anomalies in the camp location coordinates. The other automatically performed location analysis, determining in which Administrative District each camp was situated. As a result of creating these tools, they were able to save 60-70% of the time it took to manually clean and assess camp location data – around half to one day of a Cluster team member’s time, once or twice a week – freeing them up for higher value tasks. They also enabled faster identification of unrecorded camps, speeding up the delivery of aid to people in need.
Next they drew polygons of the camps, mapping their size and extent. This major task, involving creating digital maps of most of Northwest Syria using OpenStreetMap imagery, gave context to the coordinates. It hadn’t been done before and was described by the Clusters as “fantastically helpful”.
Migration mapping resources
The above describes the outputs of one MapAction mission in support of displaced people. To support the various aid agencies we work with, we also publish resources about the types of maps that can be helpful in different humanitarian situations, and information about their use.
These resources include: core maps; maps to help with work in humanitarian clusters, and specifically, where there is vulnerability or access problems during a response (e.g. food, shelter, water and sanitation, etc.); and maps that are produced in response to a particular hazard such as armed conflict.
In the case of migration, population maps, including baseline population, languages and population displacement maps, are often the most relevant. These maps may be produced in response to extensive population displacements driven by natural disasters, political unrest or a complex emergency situation. They are both strategic and operational in nature and can help all responders coordinate camps and aid response planning, including effective communication with affected people.
When it comes to migration, there are some things to bear in mind when mapping. For example, where migration is because of political persecution or war, recording camp boundaries and tagging them on a widely available map could pose a serious security risk. In these instances, it is common for some camp locations not to be shared.
Thought should also be given to the most effective way to depict on maps the movement of groups who may go through different phases of displacement. In these cases, infographic methods of sharing the data may be more suitable than maps, showing summary information and key issues without publishing sensitive locational data.
Cluster maps are used in conjunction with core maps and can specifically show where there is a particular or probable vulnerability or access problem during a response, e.g food, shelter, hygiene facilities. Within this, the camp coordination or camp management cluster helps inform planning and operation of camps. They may show camp population figures, infrastructure, hazards or resources. Planning of camp locations is driven by many spatial factors including safety and access to resources.
According to the UN Office for the Commissioner on Human Rights, an estimated 258 million people, approximately 3% of the world’s population, currently live outside their country of origin, with an increasing number being forced to migrate due to a complex mix of issues including poverty, water, food and housing. We will continue to seek and develop ever more effective mapping and geospatial data tools to support our partners who are working tirelessly to help people caught up in any situations that cause them to leave their homes.
Guatemala – video report from the airport
In this video, MapAction volunteer Emerson Tan gives a report from the airport on his way home from Guatemala.
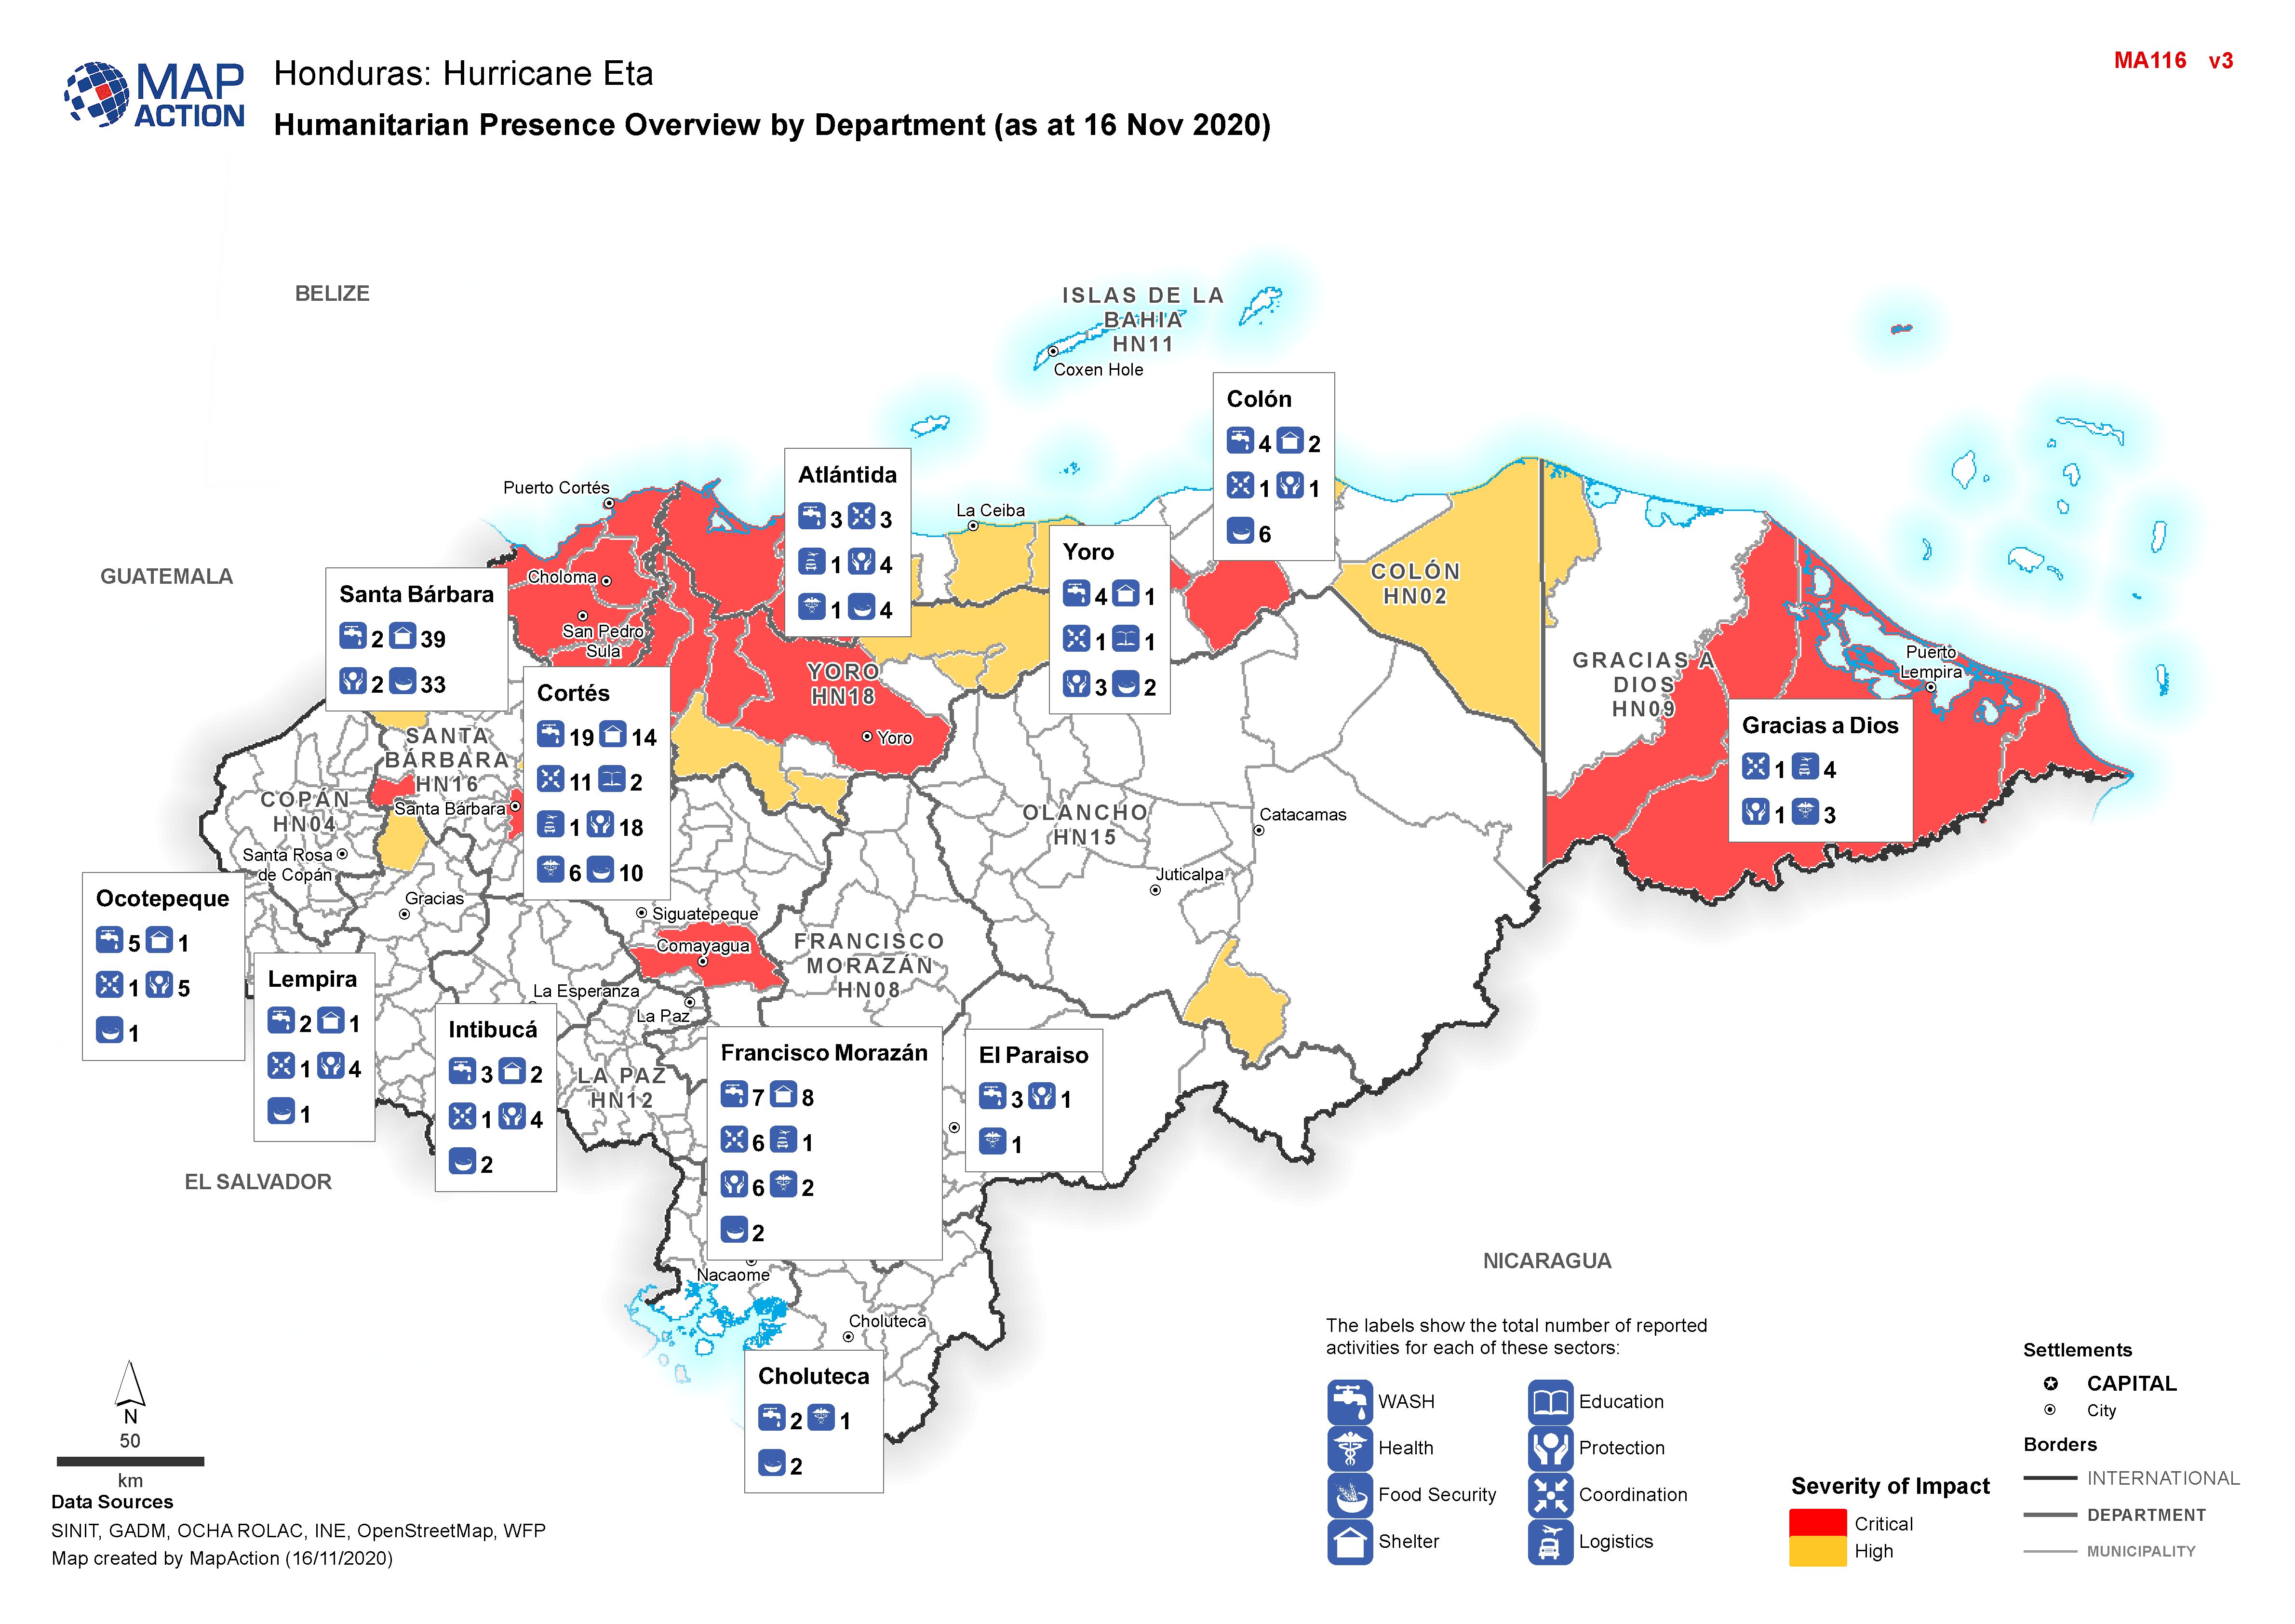
MapAction was mobilised to help the international response to the catastrophic impacts of Hurricanes Eta and Iota which have caused tremendous suffering across Central America, on top of the COVID pandemic.
Hurricanes Eta & Iota – how maps are helping
by Jon Hanson, Head of Grants Income at MapAtion
This StoryMap explains how some of the over 100 maps MapAction created following Hurricanes Eta and Iota in Central America in November 2020 are being used to help get aid to people that need it. Click here to view it in full screen.
Responding to Hurricanes Eta and Iota
Countries in Central America are facing catastrophic winds and flooding as Hurricane Iota, a Category 5 storm, makes its way across Nicaragua, Honduras and El Salvador.
With wind gusts of up to 250km/hr and torrential rain, Iota made landfall in northeast Nicaragua last night. It is compounding the damage and devastation inflicted by Category 4 Hurricane Eta, which killed at least 178 people in the region a fortnight ago and destroyed food crops for thousands of families.
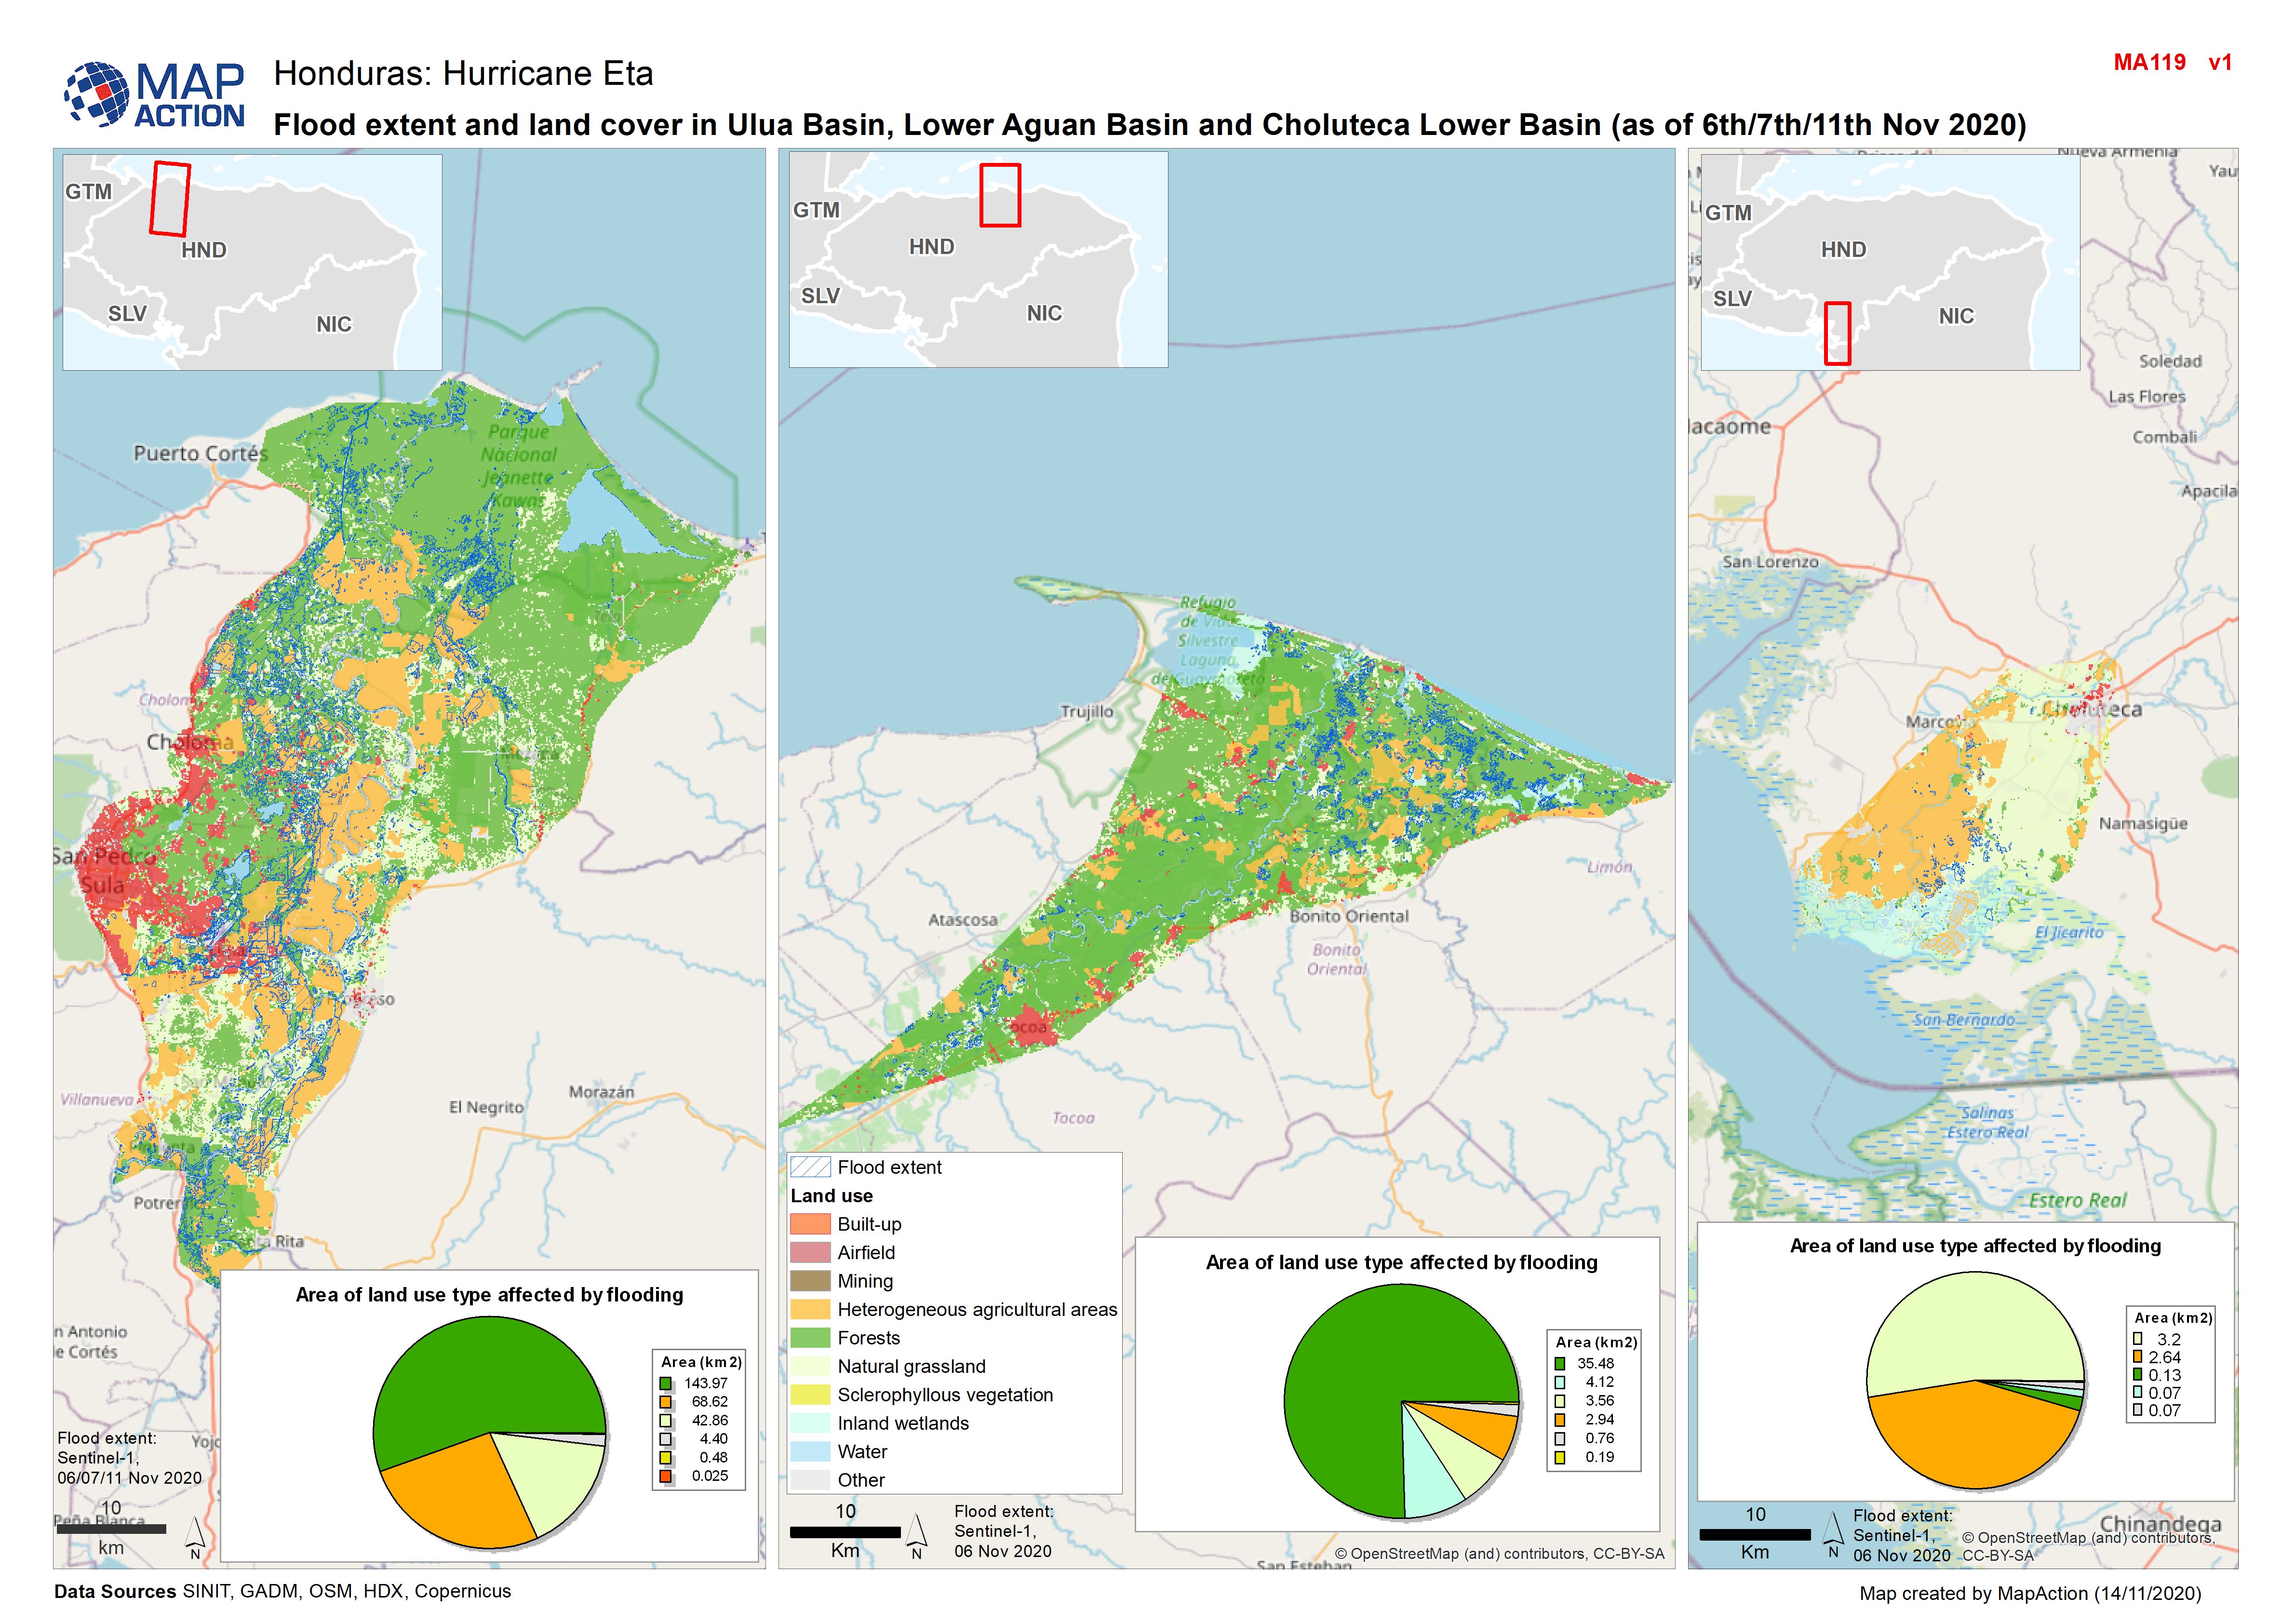
MapAction has been remotely providing full emergency support to the Latin American and Caribbean regional body of the UN’s Office for Coordination of Humanitarian Affairs (OCHA), known as ROLAC, since 6 November to assist the response to Eta and now Iota. This includes mapping storm tracks, flood extents, building damage, affected populations and information about what assistance humanitarian teams are already providing in different locations so that gaps can be identified and rapidly addressed. This work represents a scaling-up of the ongoing support to ROLAC we have been providing since September, in preparation for Hurricane season and other humanitarian issues across the region.
“Iota is hampering the response to Eta, severely degrading logistic routes and complicating the information picture,” said MapAction’s Operations Director Chris Davies. “Our maps are helping teams on the ground direct resources where they’re most needed, as safely as possible. We will continue to provide support to our ROLAC colleagues and are anticipating and preparing for additional requests for our assistance.”
We’re grateful to the German Federal Foreign Office for supporting our response, as well as to the Netherlands Ministry of Foreign Affairs and the UK FCDO for their continued support of MapAction’s response capacity.
Ten tips for making simple, informative maps in a pandemic
MapAction has been collaborating for a number of years with French NGO and fellow humanitarian information management specialists CartONG.
In addition to our operational activities, we thought it would be worthwhile to pool our collective knowledge to create an informative article. The ten-minute read aims to give some helpful tips for people creating maps intended to assist humanitarian responses to the Corona virus and other pandemics.
Between us, we have a lot of experience of using geospatial analysis and visualisations to inform decision-making in this and previous epidemics, such as Ebola, as well as the current pandemic. We wanted to share this knowledge more widely and felt that, by working together, we could create something really useful and reach more people. Although it was written with pandemics in mind, many of the points apply to all kinds of map making.
You can read the article on the CartONG blog below.

This project was co-funded by the French Development Agency (AFD) and the H2H Network’s H2H Fund, the latter supported by UK aid from the UK government.
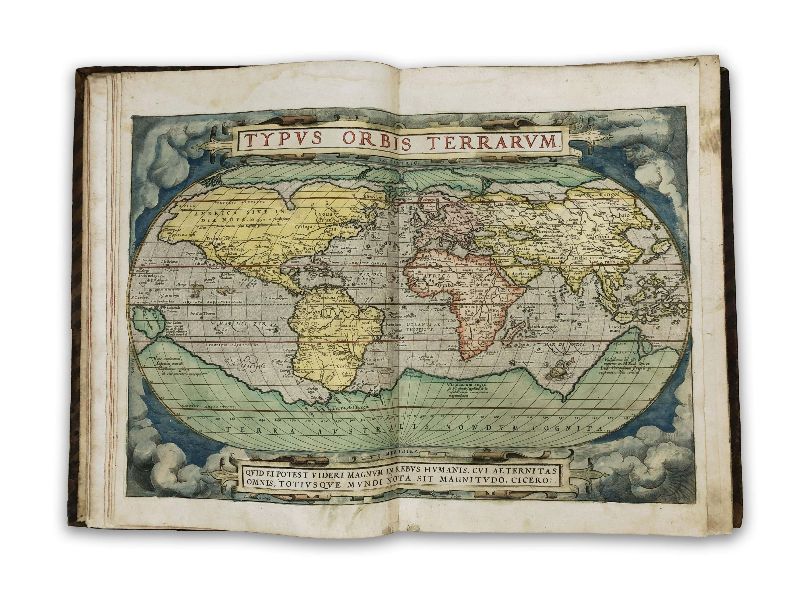
Auction of famous antique map collection
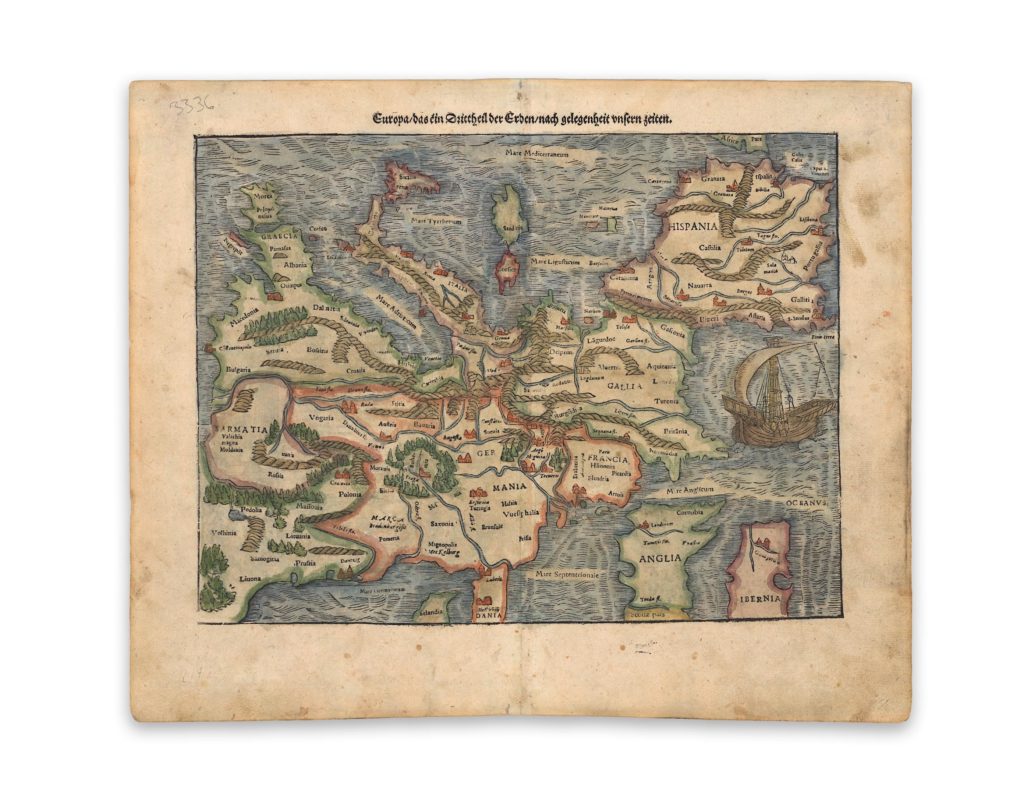
MapAction ambassador Farhad Vladi is a world-renowned collector of antique maps. Over many years, he has travelled the world, seeking out the finest, rarest, and most beautiful examples of early cartography.
Now he is putting this incredible collection up for auction, with a percentage of the proceeds benefiting the work of MapAction.
Included in the sale is the first map to be printed from woodblock (Magna Germania, created by Ptolemäus in 1486), marking the start of modern map making, as well as maps from the world’s most noted cartographers, including Gerard Mercator, Willem Jansz Blaeu, Abraham Ortelius, Johann Baptist Homann, Sebastian Münster, and Matthäus Seutter.
MapAction Past & Future auction lot
Bidders can also purchase one of the first three MapAction Past & Future Packages. This will enable them to select a map from a back-catalogue of thousands of maps, each of which tells its own story. The map will be a framed, printed version, signed (where possible) by one or more of the team members that attended that emergency and made that map. MapAction will also provide a short description of the purpose and situation for which the map was made.
In buying a map from a past emergency, they will also be helping to fund MapAction’s ability to support future emergencies. To recognise that, the winning bidders can choose any map that appears in our online map library arising from a future response, and MapAction will send a digital copy of that map, along with a sincere message of thanks.
The auction takes place on 23 September 2020 at 12:00pm EST and is open to all. It will be hosted on Liveauctioneers.com, Invaluable.com, and Bidsquare.com. Bidders can participate online, through absentee bidding, or phone bidding.
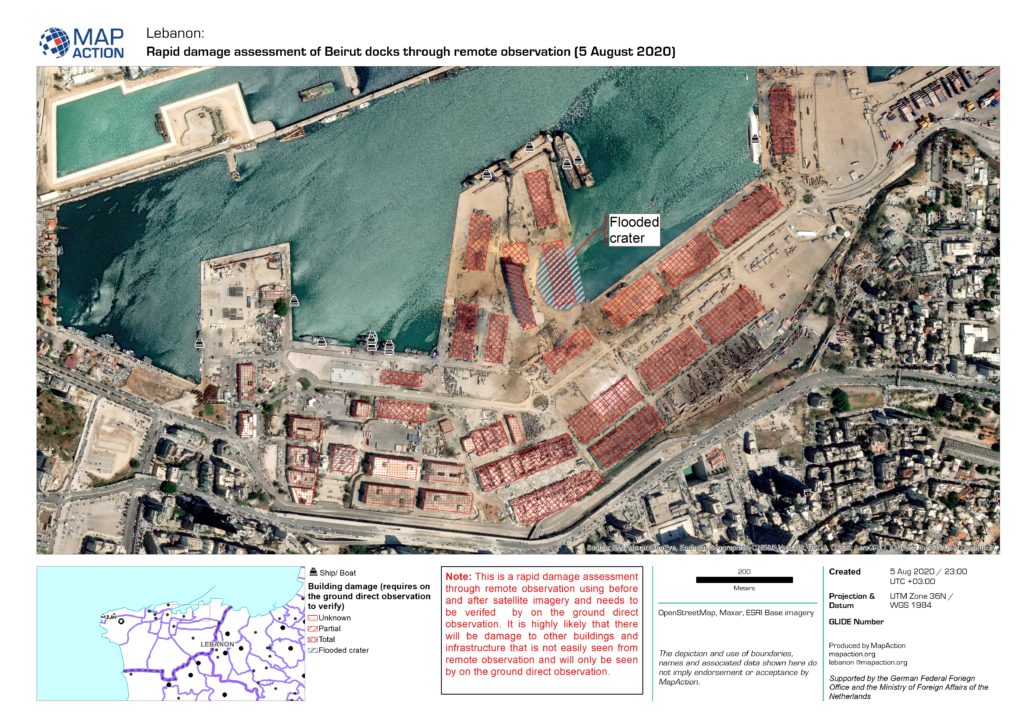
Responding to the Beirut explosion
MapAction personnel began working yesterday on gathering data and producing reference and situational maps for use by first responders and humanitarian teams in Beirut following the devastating explosion that ripped through the city on 4 August.
A three-person MapAction team will arrive in Beirut tomorrow or Saturday to provide mapping and data management support to help coordinate the national and international response, at the request of the UN Disaster Assessment and Coordination (UNDAC). They will be supported remotely by other members of the MapAction team based in the UK.
MapAction’s Moonshot – origins and ambitions
By Juan Duarte, Technical Director, and Monica Turner, Data Scientist, MapAction

.jpg)
History will always underscore how landing on the moon represented a significant milestone in the space race, yet what is often less spoken about is the number of technologies that might not have ever made it without space travel.
These include the all-important ability to take pictures on our phone, thanks to the technology originally created by a team at the Jet Propulsion Laboratory, and the technique used to develop diamond-hard coatings for aerospace systems that can now be found on scratch-resistant spectacles. Inventions that originally started life with a bigger purpose but have filtered down into solving some of the challenges in our everyday lives.
This brings us onto MapAction’s own Moonshot initiative – an ambitious programme of work encompassing step changes in the way we use different technologies in the course of our work. This includes things like how we triage, assign and manage the requests for support we receive, and how we can automate certain repeat activities.
One of the first projects we are working on within the Moonshot programme will enable us to produce seven to nine key maps for 20 of the world’s most vulnerable countries automatically, using technology we’re developing that will provide benefits for many years to come. This is being funded through our partnership with the German Federal Foreign Office.
In the humanitarian sector, a perennial challenge is access to high-quality data. This need is even more acute in the chaotic aftermath of a humanitarian emergency, when data and maps are crucial to make rapid sense of the situation and plan the best response to save lives and minimise suffering.
In the early hours of a crisis, one of the first tasks facing our team is to produce standardised ‘core’ maps that will be used throughout the response, regardless of the nature of the emergency. These provide contextual and reference information about, among other things, the local environment, population and infrastructure. Sometimes they are created under difficult on-the-ground conditions or with incomplete information. Once they are in place, they are used to create additional situation-specific maps by layering on top evolving information about the extent and impacts of the emergency and the humanitarian response.
As MapAction has made maps in hundreds of emergencies, it has become apparent that, in creating these foundational core maps, there are many repeatable, generalised tasks that could be handled much more quickly by a machine, achieving in seconds what used to take hours. This would give humanitarian decision-makers the orientation information they need immediately, and free up our specialist volunteers for actively assessing and engaging with the situation at hand and performing the mapping tasks that only humans can do.
Moreover, by shifting the focus from reactive to proactive data sourcing and map production, we can ensure we provide the best maps possible – not just the best maps, given the time and data available and the prevailing circumstances in the midst of a humanitarian emergency.
Many countries, particularly low and middle-income countries, are likely to have data gaps, and they are often also the countries that may have the least resilience to emergencies such as droughts or earthquakes. Identifying and addressing these data gaps in advance is a big part of the Moonshot project, and something that will have benefits for the humanitarian sector as a whole.
Like the proverbial needle in the haystack, important data can exist within a subset of a much larger dataset and accessing it can be tricky. Finding a gap is even more difficult, as you’re looking for an unknown entity that isn’t there. The technology we’re developing for the Moonshot will help us to identify the hard-to-see data gaps and quality issues that currently exist. By discovering these, we can pinpoint what information will be needed to ensure a complete map and then work with partners around the world to proactively put in place missing data or improve what currently exists.
The initial goal of the Moonshot is to publish 180 core maps (nine for each of the 20 vulnerable countries identified at the beginning of the project). The same processes will then be applied to other countries and, eventually, to other types of automated maps beyond these core ones. This means we will ultimately be in a position to expand our understanding and quality assessment processes for more data types. New opportunities and routes of travel are likely to emerge as the project develops.
The ambition is big, but the possibilities that will result from achieving this goal will fundamentally change the way we approach map creation in the humanitarian sector in the future.
In a series of blogs over the next few months, we will share the story of this work as it unfolds, as well as diving down deeper into specific elements of it.