Colour in mapping

By Jo Pratt, MapAction’s Communications Lead

March 9-10 is Holi, an ancient Hindu festival celebrating the arrival of spring with a riot of colour. To mark the occasion I asked the MapAction members for their interesting tips, facts, examples and experiences – anything they felt moved to share – about the use and importance of colour in mapping.

A few people sent me examples of maps they’ve created in which colour was particularly important in communicating and differentiating between different layers of information. Colour can be used to increase the amounts and types of information a map contains without reducing its readability. Divergent colours are often used to differentiate between types of data shown, while sequential colour scales can show degrees of prevalence of a particular feature.

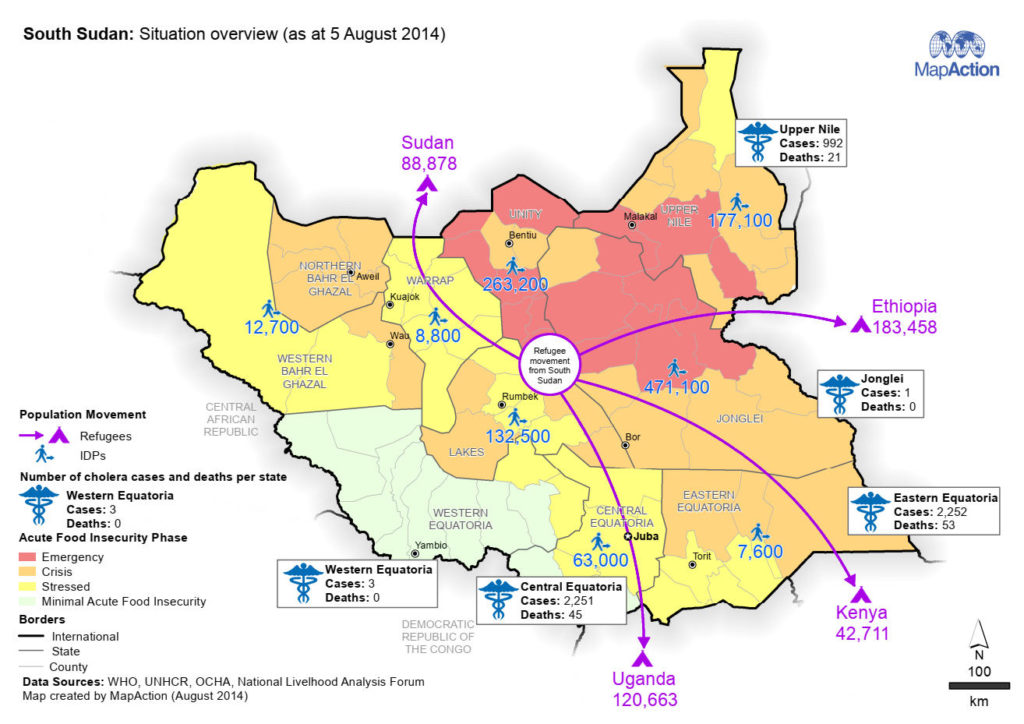
MapAction’s Geospatial Services Coordinator, Matt Sims, shared with me a map of South Sudan he produced in 2014 for our partner ACAPS. He used divergent colours to differentiate between layers of information including data about food security, health and internally displaced people (IDP) movements. At the same time, a sequential colour scale gives an immediate visual indicator of the severity of the food insecurity in each county.

In this colourful 2017 language map of Borno, Eastern Nigeria (below), MapAction volunteer Mark Gillick used divergent colours to show at a glance which groups of IDPs were in locations with a local language other than their own. The map also shows the size and location of each community.

“This is the most colourful MapAction map I’ve made.”
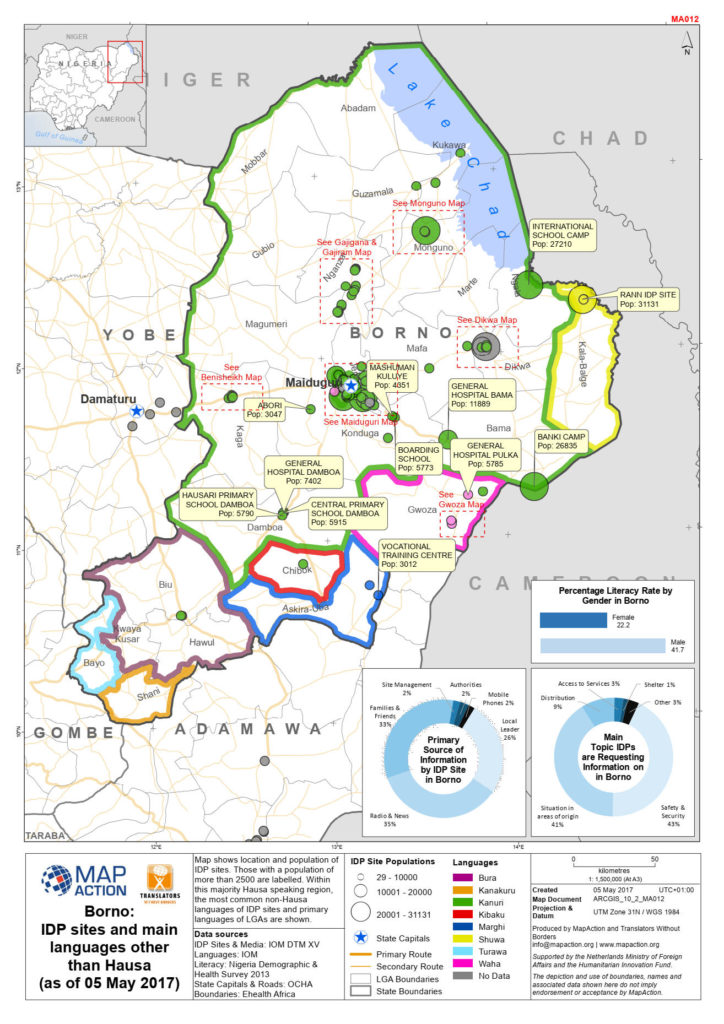
MapAction volunteer, Mark Gillick

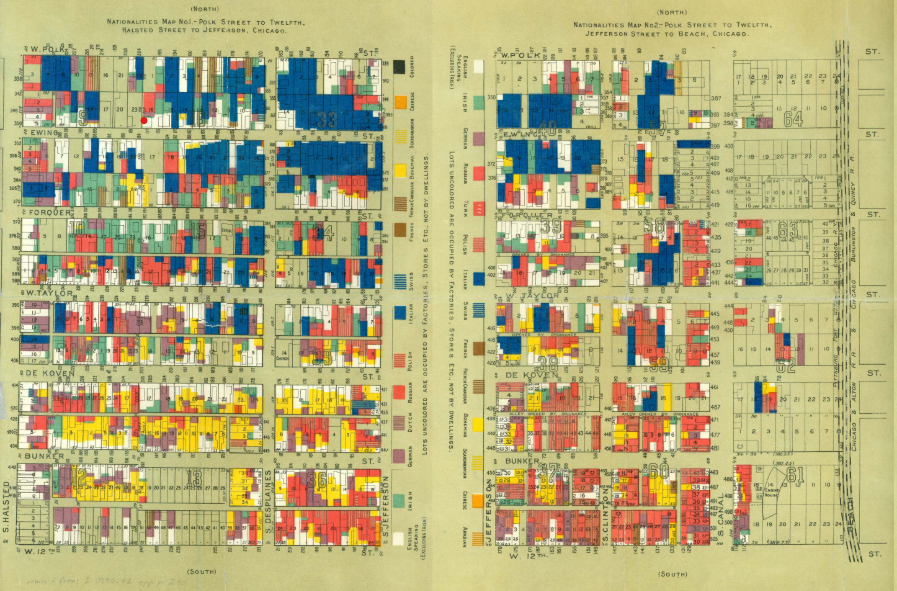
Mark also flagged up the use of divergent colour to enhance communication in the London Underground map and the map below from 1895 of different nationalities in Chicago, USA.

1895 map of nationalities in Chicago

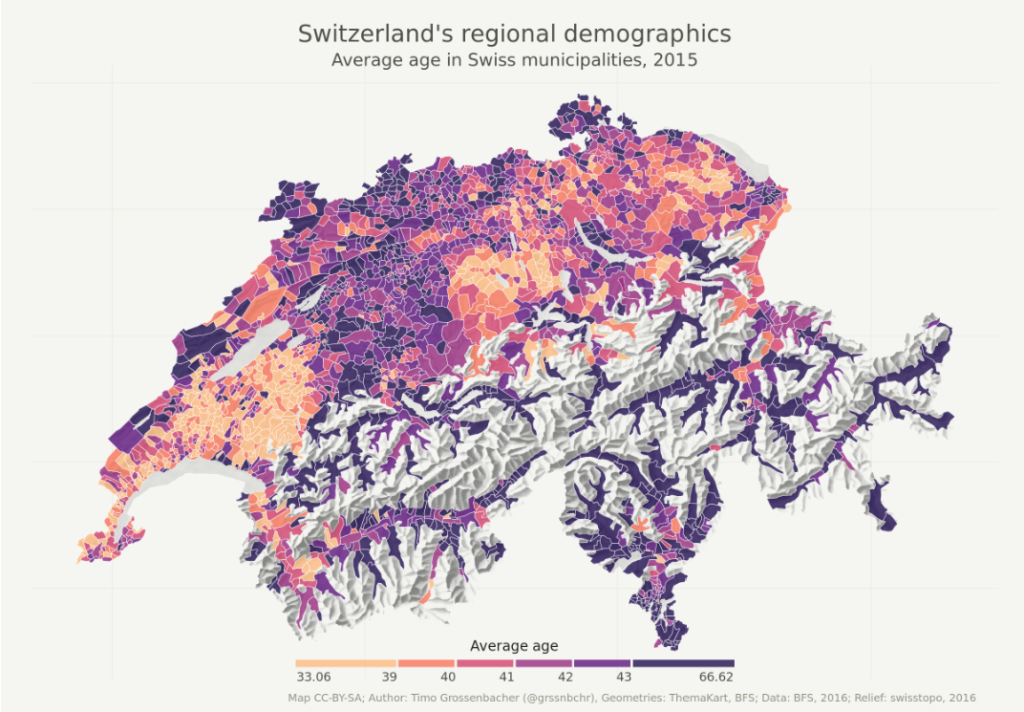
MapAction’s Head of Training and Learning Emma Mumford pointed me to a lovely looking and rather fascinating thematic map of age demographics in Switzerland created by mapping blogger Timo Grossenbacher. The sequential colour scale shows how different age groups are clustered in certain areas. It also demonstrates why yellow is generally taken to be a highlight colour, as the yellow and orange areas stand out against the purples.

Thematic map of age demographics in Switzerland

Colour considerations and cautions

I had an interesting chat with MapAction volunteer duo Becky and Andy Kervell. As well as flagging up ColorBrewer as a useful mapping resource, they talked me through some of the issues to bear in mind when thinking about colour choices.

  • Colour blindness – this is quite a common problem. Most people with colour-vision deficiency have difficulty distinguishing between red and green. ‘Red-green’ deficiency affects one in 12 men and one in 200 women globally and can make it hard for them to tell the difference between reds, oranges, yellows, browns and greens. They may also have difficulty distinguishing between shades of purple and may not be able to tell red from black. ‘Blue-yellow’ deficiency – affecting vision of blues, greens and yellows – is another form of colour blindness that is much rarer. This Brilliant Maps blog explores what maps look like to people with colour-vision deficiency.
  • Format, use and context – colours look different on screen compared to paper, so the ways in which a map is distributed and used should affect colour choice. If a map is intended to be desktop printed, questions around the quality and availability of printers and inks arise. If a colour map is printed in black and white, will it still be fit for purpose? If a map is shown via a projector, will details be visible?
  • Cultural significances – colours have different meanings and associations in different parts of the world. For example, in some cultures, death is associated with black; in others, with white. Red can be associated with danger, good fortune or grief and death, among other things, depending on where you are. This is one good reason why team diversity, as well as awareness of and consideration for different cultures, is important in mapping – as elsewhere in life.

Another interesting fact I learned in the course of compiling this blog is that mappers use up a lot of blue ink. Because – oceans. According to MapAction’s logistics manager Andy Punter, who looks after all the kit used by our teams on deployment, we get through three or four times as many cyan ink cartridges as any other colour. So, if you ever come across a map with feathering around a land mass to denote the sea instead of a solid block of blue, thriftiness could be the reason.

This is the first in an irregular series of blogs in which we use an international event such as Holi, as an excuse (as if one were needed) to celebrate the diversity of mappers, maps and mapping.

Diversity and MapAction

Video interview

Earlier this year, MapAction’s CEO Liz Hughes blogged about diversity in the humanitarian and technology/GIS sectors and why it’s important. Since then, we’ve been working to evolve our practices in this area.

MapAction volunteer Bel Hewitt has been involved in shaping our diversity and inclusion policy and helping us to work towards our objectives. The policy outlines MapAction’s commitments, accountability and actions on all aspects of diversity.

Bel lives in the Philippines, so we took the opportunity to catch up with her for an informal chat about where we’re at with it and where we want to get to when she stopped by our UK office on a holiday visit today.

Reflecting on World Humanitarian Day

By Liz Hughes, MapAction CEO

Today is World Humanitarian Day and the theme this year is Women Humanitarians. I find that an interesting theme. I am, indeed, personally grateful to all the female humanitarians – including our own volunteers and staff – who inspire, challenge, advise, listen and make a difference. As well as experiencing barriers to participation in formal humanitarian responses, women are often also at greater risk in emergency situations. So anything that highlights and begins to address these issues is to be welcomed.

World Humanitarian Day is often interpreted as being about the workers, not the affected communities. Yet, it seems to me that humanitarianism is in fact about people’s suffering and what helps. So, in general, I think the message should be about the amazing survivors of conflict and disaster, the ways communities recover together and the women in those communities who contribute to that. 

It is good to make note of differences of perspective (gender being just one), but we need to take care that that is not where our acknowledgement of difference starts and stops, with just one day. If we want to promote a really inclusive humanitarianism, we need to think about these differences and contributions every day, and make our efforts towards inclusion and diversity part of the way we live and work. There is much more work to be done.

To this end, we are in the process of examining in detail and systematically improving our own working practices. During our monthly team training weekend in July, our Diversity Working Group presented the findings of a recent team survey on the topic of diversity within MapAction. Although the sample size was too small to be statistically significant, it enabled us to ask some good questions. Together we discussed some concrete next steps. We will share more on these once they are more fully developed.

Our journey towards equality

By Liz Hughes, MapAction Chief Executive

International Women’s Day is as good a day as any to reflect on gender diversity in the humanitarian and geospatial technology sectors and on what MapAction is doing to ensure equality of opportunity for everyone.

Globally, the proportion of women in the humanitarian sector workforce is high compared to other business sectors, but they are significantly under-represented at leadership level. The gender gap is more pronounced in the tech sector, where LinkedIn data indicates women make up just 27% of the total global workforce, and fewer than one in five female employees reach positions of leadership. That is very worrying when you consider that technology is, in a very real way, shaping the world in which we all live.

Some research suggests that women are better represented in the GIS (geographical information systems) sector than in other technology fields, and, according to our friends at Open Street Map, this is particularly true within the fields of humanitarian and disaster response mapping.

All of this indicates that MapAction, operating as it does at the centre of the Venn diagram of humanitarian emergencies and geospatial information, should be able to achieve gender parity. As an organisation committed to equal opportunities, that is certainly our aim, and one towards which we are steadily progressing, but have yet to attain.

We are fortunate enough to have as distinguished a female geographer as Dr Barbara Bond, Past President of the British Cartographic Society and Fellow and Past Council Member of the Royal Geographical Society, as a Trustee. As well as this, our senior leadership team is evenly balanced by gender. However, currently the overall proportion of women in the organisation is around 30%. Within our volunteer team, where much of our GIS and tech expertise resides, the figure is 26% and currently only a fifth of our ten Trustees are women. We can and will do better.

Why diversity matters

This is important for several reasons. It is certainly desirable that women and other under-represented groups have the opportunity to experience the tremendous personal and professional benefits of being a MapAction volunteer, so they can bring all that learning and personal growth back to help their own organisations and careers. In addition, part of the volunteer experience is belonging to a close community of GIS professionals with whom you work, train, socialise and share some very unique and powerful experiences. As one of our volunteers Kirsty Ferris put it, the “great support, understanding and shared geekiness” is invaluable. According to Kirsty, “There are not many places where you can talk GPS and geodesy with such shared enthusiasm.” To have that kind of peer support network can be vital when 62% of women say they do not see themselves staying in GIS for more than ten years. We need to ensure we have a diverse mix of people, so that all members of our team feel they belong.

But over and above the importance of diversity to our team is its importance for the work we do and the people who’s lives we are seeking to save and improve. The maps we create are a product or our collective know-how and team experience. As Andrew Foerch explains in his article ‘The Importance of Diversity in Cartography’, “Maps are more likely to address problems visible to the people who create them. For example, male and female responses might differ significantly if asked to map safe walking routes through a city.”

Thinking differently can make a difference

GIS and technology expert volunteers make up the lion’s share of MapAction’s membership – we have over 80, plus 10 Trustees, compared to a staff team of 17, most of whom are part-time. We recruit our volunteers once a year, enabling us to train each new intake group together, in order to equip them with all the skills they need to operate effectively within a disaster zone.

Our volunteer recruitment drive is an important annual activity and each new year group brings fresh energy and experience as well as new personalities to our team. The number of men applying to volunteer and making it through our rigorous selection process has nearly always exceeded the number of women. This has always been a concern, but the problem became urgent in 2017 when for the second time in three years, all the successful applicants were male, and only three women were recruited during the three-year period out of a total of 25.

To address the issue, we set up a working group of volunteers and staff members to review our recruitment and also working practices and develop a plan of action. A number of actions came out of that process:

  • We reviewed our GIS volunteer profile to ensure it was attractive to and inclusive of under-represented groups.
  • We published profiles of a diverse group of volunteers and offered to connect prospective applicants with them to find out more about what it’s like to be a MapAction volunteer.
  • We made sure a statement about our commitment to diversity and equal opportunities was included in all our recruitment materials.
  • We broadened the advertising strategy of our recruitment drive, to incorporate organisations such as Women in Technology and Girls Who Code.
  • In order to ensure there are no barriers to entry for any particular group due to unconscious bias on the part of those shortlisting candidates, we are looking at removing all information pertaining to gender, age, ethnicity, disability, etc. from applications.

It is still early days, and there is still much more to do, but it was gratifying to see that our 2018 volunteer intake achieved gender parity at least. We will continuously evaluate and improve our approach. There is tremendous commitment within our staff and volunteer teams to achieve our diversity objectives as part of making MapAction as good as it can be. With that momentum behind us I’m confident that we will get there.