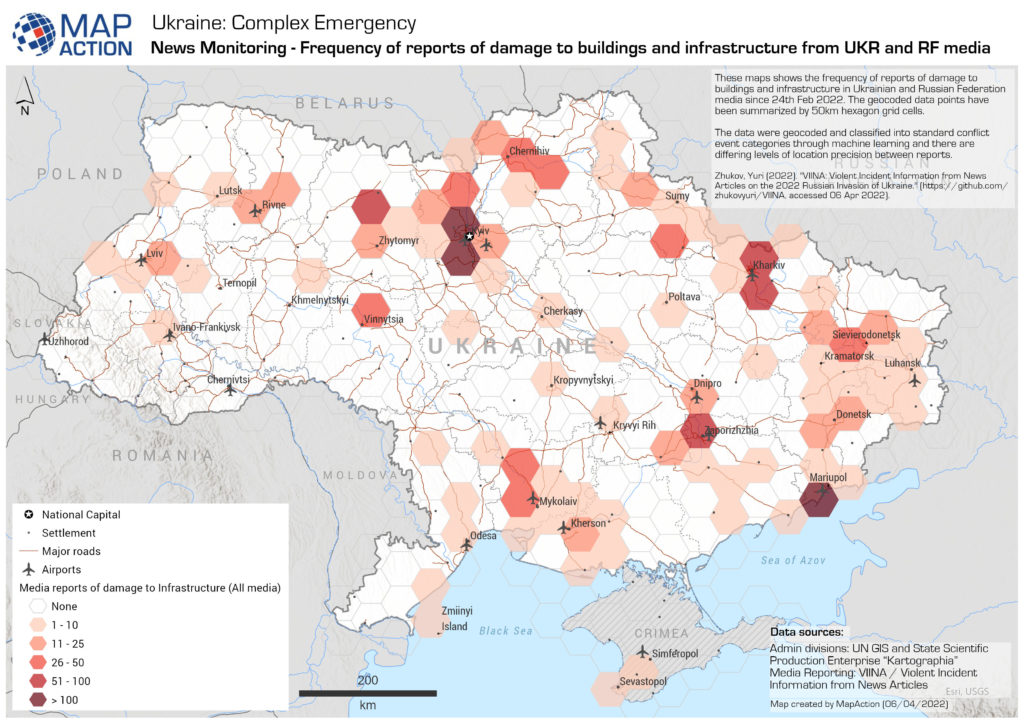
Sources: Admin divisions: UN GIS and State Scientific Production Enterprise “Kartographia”, Media reporting: VIINA/ Violent Incident Information from News Articles.
MapAction continues to support humanitarian efforts relating to Ukraine. Most recently this has been through the Information Management and Analysis Cell (IMAC) at the UN Office for the Coordination of Humanitarian Affairs (UN OCHA) headquarters in Geneva.
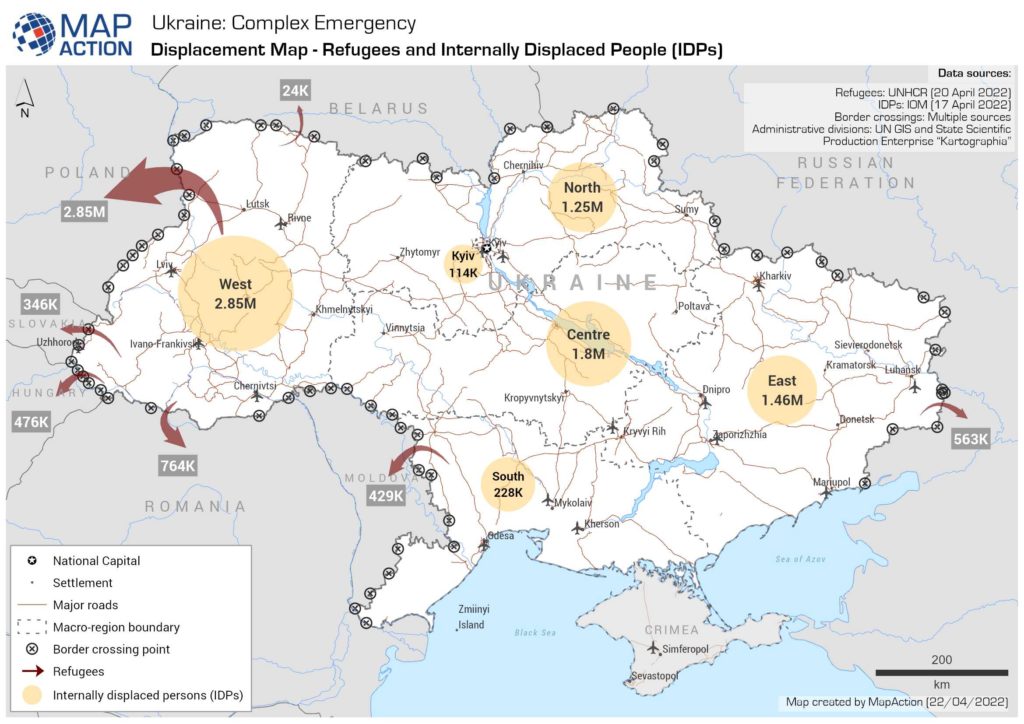
We have seconded a team member to map and analyse data and information relating to the many humanitarian needs and responses in Ukraine. This includes refugee movements to and from neighbouring countries. The work feeds into IMAC situational analysis briefings.
Data sources: Refugees: UNHCR (20.4.2022), IDPs: IOM 17.4.2022, Border crossings: Multiple sources, Administrative divisions: UN GIS and State Scientific Production Enterprise “Kartographia”.
MapAction are very grateful to RenaissanceRe for funding this important work, as part of the new funding partnership formed in 2021.
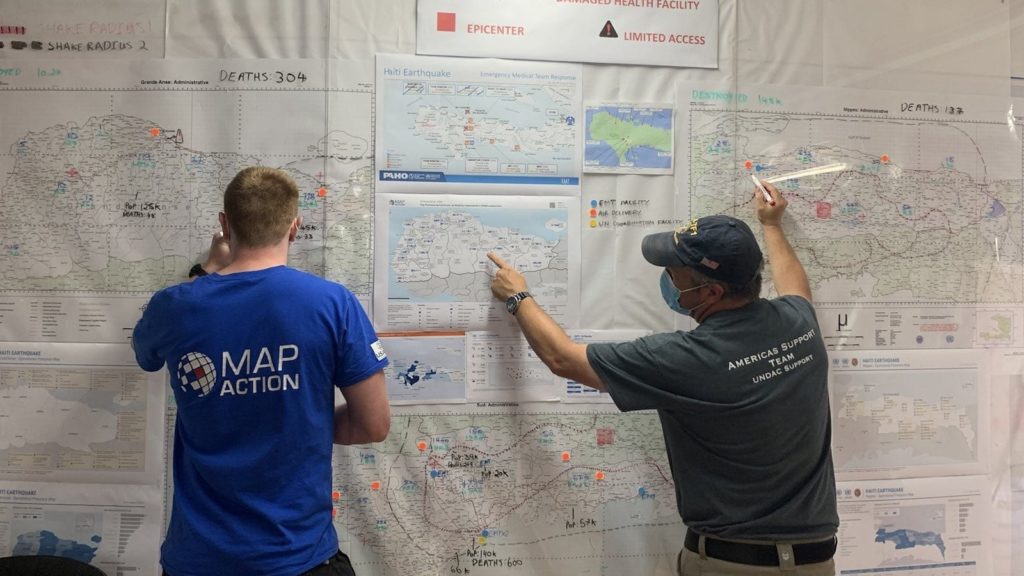
MapAction volunteer Chris Jarvis and a colleague from the Americas Support Team.
MapAction has been involved in the response to the earthquake that took place in Haiti on 14 August, helping our partners with data processing, analysis and mapping. This has helped those coordinating operational teams to understand what types of aid are needed in different locations and what other organisations are already doing to help. At the time of writing, this work is ongoing.
At the end of August, we scaled up our support to the UN Disaster Assessment & Coordination (UNDAC) and other responding organisations. Two MapAction volunteers traveled to Haiti to provide in-person assistance, supported remotely by our wider team. As well as using their annual leave to do this, both were required to self-isolate for 10 days after returning to the UK, in accordance with COVID rules. We are grateful to them both for their invaluable efforts.
This StoryMap looks at some of the maps that have so far been created during the response to the earthquake and how they have been used to help the situation on the ground.
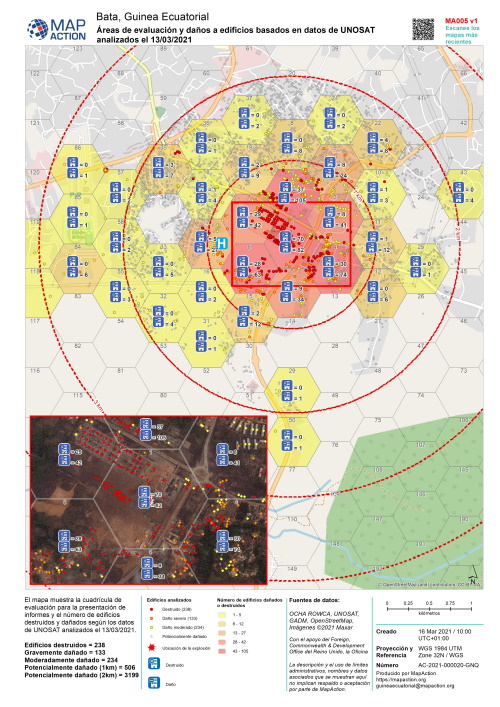
Following a series of explosions on 7th March at an armoury of the Nkuantoma Gendarmerie and military barracks in Bata, the economic capital of Equatorial Guinea, The United Nations Disaster Assessment and Coordination (UNDAC) reached out to MapAction to support the response. Over 100 people were reported to have been killed and 700 injured in the blasts which caused significant damage to buildings and infrastructure.
Using learning and expertise from previous missions, including the major explosion last August in Beirut and a similar incident in Brazzaville in 2012, MapAction will be on hand to help remotely as long as needed.
We are working with the UN Assessment & Analysis (A&A) Cell to provide impact and situational mapping of the explosion areas with a focus on shelter, health and water, sanitation & hygiene (WASH). A&A cells are responsible for the coordination of needs assessments and analysis during sudden-onset emergencies to inform humanitarian partners, such as governments, aid agencies, NGOs etc.
This response is being supported by the UK’s Foreign, Commonwealth and Development Office (FCDO). MapAction’s response capability is also supported by the Netherland’s Ministry of Foreign Affairs.
December 18 marks The United Nations (UN) International Migrants Day, recognising the efforts, contributions, and rights of migrants worldwide. In light of this, we decided to share some of the work we did this year during the Syria crisis to highlight some of the challenges of meeting the needs of migrant populations, and also explore the role that maps can play when people are displaced from their homes.
MapAction was asked by the UN’s Office for the Coordination of Humanitarian Affairs (UN OCHA) to send a team to Turkey. Their mission: to help humanitarian teams there and in Northwest Syria supporting almost one million people – 60% of them children – that arrived in the region during January-March 2020, following an upsurge of fighting in Aleppo.
A population displacement of this scale and speed results in great vulnerability for those involved, as well as many unknowns for humanitarians about people’s access to essential things like food, water, sanitation and shelter. And that’s before you factor in the added complication of COVID.
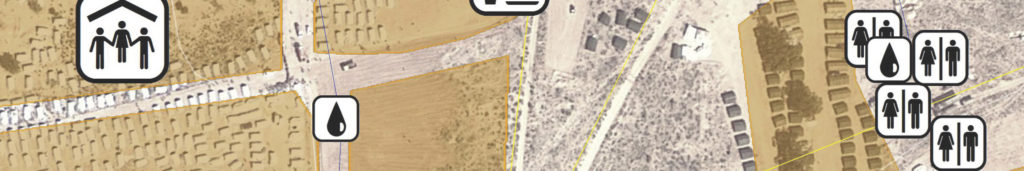
Camps vary enormously, from just a few tents to the size of a small city, and from temporary to long-term settlements. Some are isolated, while others are grouped together. Getting clean, up-to-date data about them is essential for the Clusters to coordinate life-saving aid.
MapAction’s aim was to grant the Cluster coordinators a ‘single source of truth’ about the locations and sizes of the camps, to enable them to understand their population density and meet the needs of the people arriving and living in them. The imminent threat of COVID-19 made this even more urgent and important – not to mention more difficult.
‘Data cleaning’ is a vital part of the process. Camp data is often captured by collectors with varying levels of training, network connectivity and other obstacles. Sometimes geographical coordinates are estimated from a central location instead of using GPS, or transcribed manually, introducing human errors. The same data might be captured several times by different organisations, with different results. All of this can make it difficult to pinpoint the exact locations of camps and could cause them to be missed or double counted, resulting in delays or complete omissions in aid delivery.
Camps vary enormously, from just a few tents to the size of a small city, and from temporary to long-term settlements. Some are isolated, while others are grouped together. Getting clean, up-to-date data about them is essential for the Clusters to coordinate life-saving aid.
The MapAction team compared a core list of 700 sites against a further list of 600 camps, and used GIS analysis to deduplicate against location, site name and then visually against the latest satellite imagery, to confirm locations. Over three iterations, they were able to support the CCCM Cluster to improve the core list from 700 to around 1,000 sites.
To aid this process in Syria, our team created two data tools. One helped to identify anomalies in the camp location coordinates. The other automatically performed location analysis, determining in which Administrative District each camp was situated. As a result of creating these tools, they were able to save 60-70% of the time it took to manually clean and assess camp location data – around half to one day of a Cluster team member’s time, once or twice a week – freeing them up for higher value tasks. They also enabled faster identification of unrecorded camps, speeding up the delivery of aid to people in need.
Next they drew polygons of the camps, mapping their size and extent. This major task, involving creating digital maps of most of Northwest Syria using OpenStreetMap imagery, gave context to the coordinates. It hadn’t been done before and was described by the Clusters as “fantastically helpful”.
Migration mapping resources
The above describes the outputs of one MapAction mission in support of displaced people. To support the various aid agencies we work with, we also publish resources about the types of maps that can be helpful in different humanitarian situations, and information about their use.
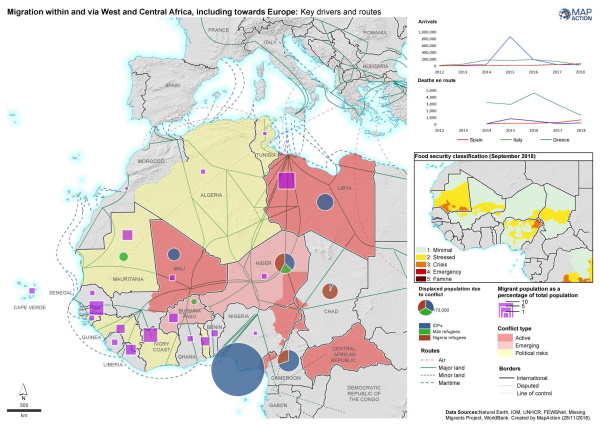
In the case of migration, population maps, including baseline population, languages and population displacement maps, are often the most relevant. These maps may be produced in response to extensive population displacements driven by natural disasters, political unrest or a complex emergency situation. They are both strategic and operational in nature and can help all responders coordinate camps and aid response planning, including effective communication with affected people.
When it comes to migration, there are some things to bear in mind when mapping. For example, where migration is because of political persecution or war, recording camp boundaries and tagging them on a widely available map could pose a serious security risk. In these instances, it is common for some camp locations not to be shared.
Thought should also be given to the most effective way to depict on maps the movement of groups who may go through different phases of displacement. In these cases, infographic methods of sharing the data may be more suitable than maps, showing summary information and key issues without publishing sensitive locational data.
Cluster maps are used in conjunction with core maps and can specifically show where there is a particular or probable vulnerability or access problem during a response, e.g food, shelter, hygiene facilities. Within this, the camp coordination or camp management cluster helps inform planning and operation of camps. They may show camp population figures, infrastructure, hazards or resources. Planning of camp locations is driven by many spatial factors including safety and access to resources.
According to the UN Office for the Commissioner on Human Rights, an estimated 258 million people, approximately 3% of the world’s population, currently live outside their country of origin, with an increasing number being forced to migrate due to a complex mix of issues including poverty, water, food and housing. We will continue to seek and develop ever more effective mapping and geospatial data tools to support our partners who are working tirelessly to help people caught up in any situations that cause them to leave their homes.
In this video, MapAction volunteer Emerson Tan gives a report from the airport on his way home from Guatemala.
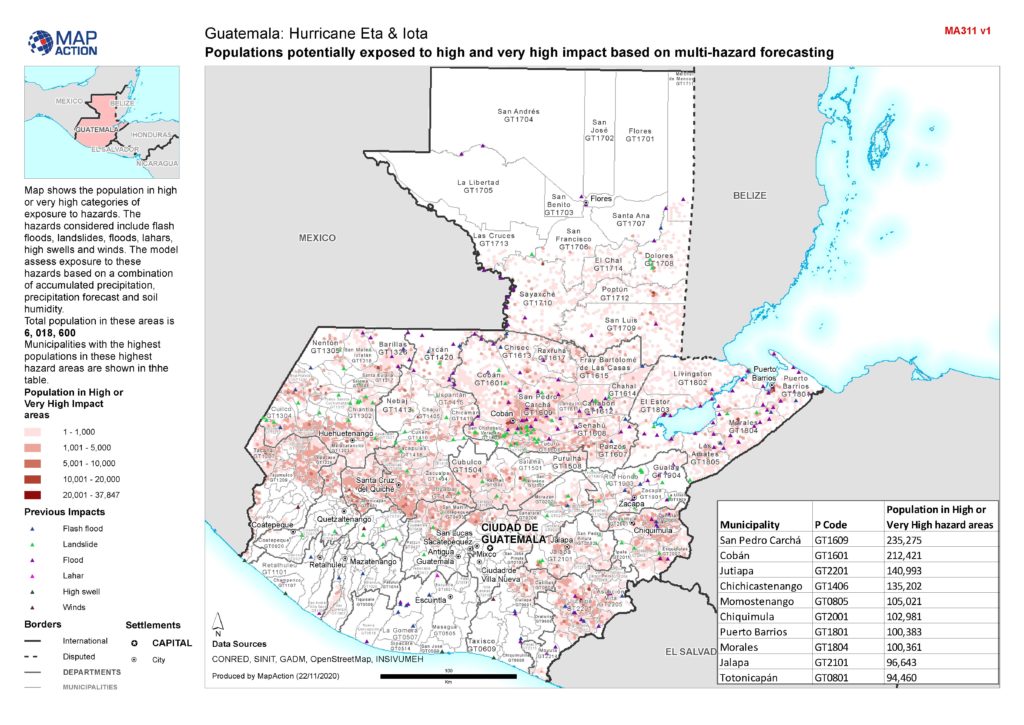
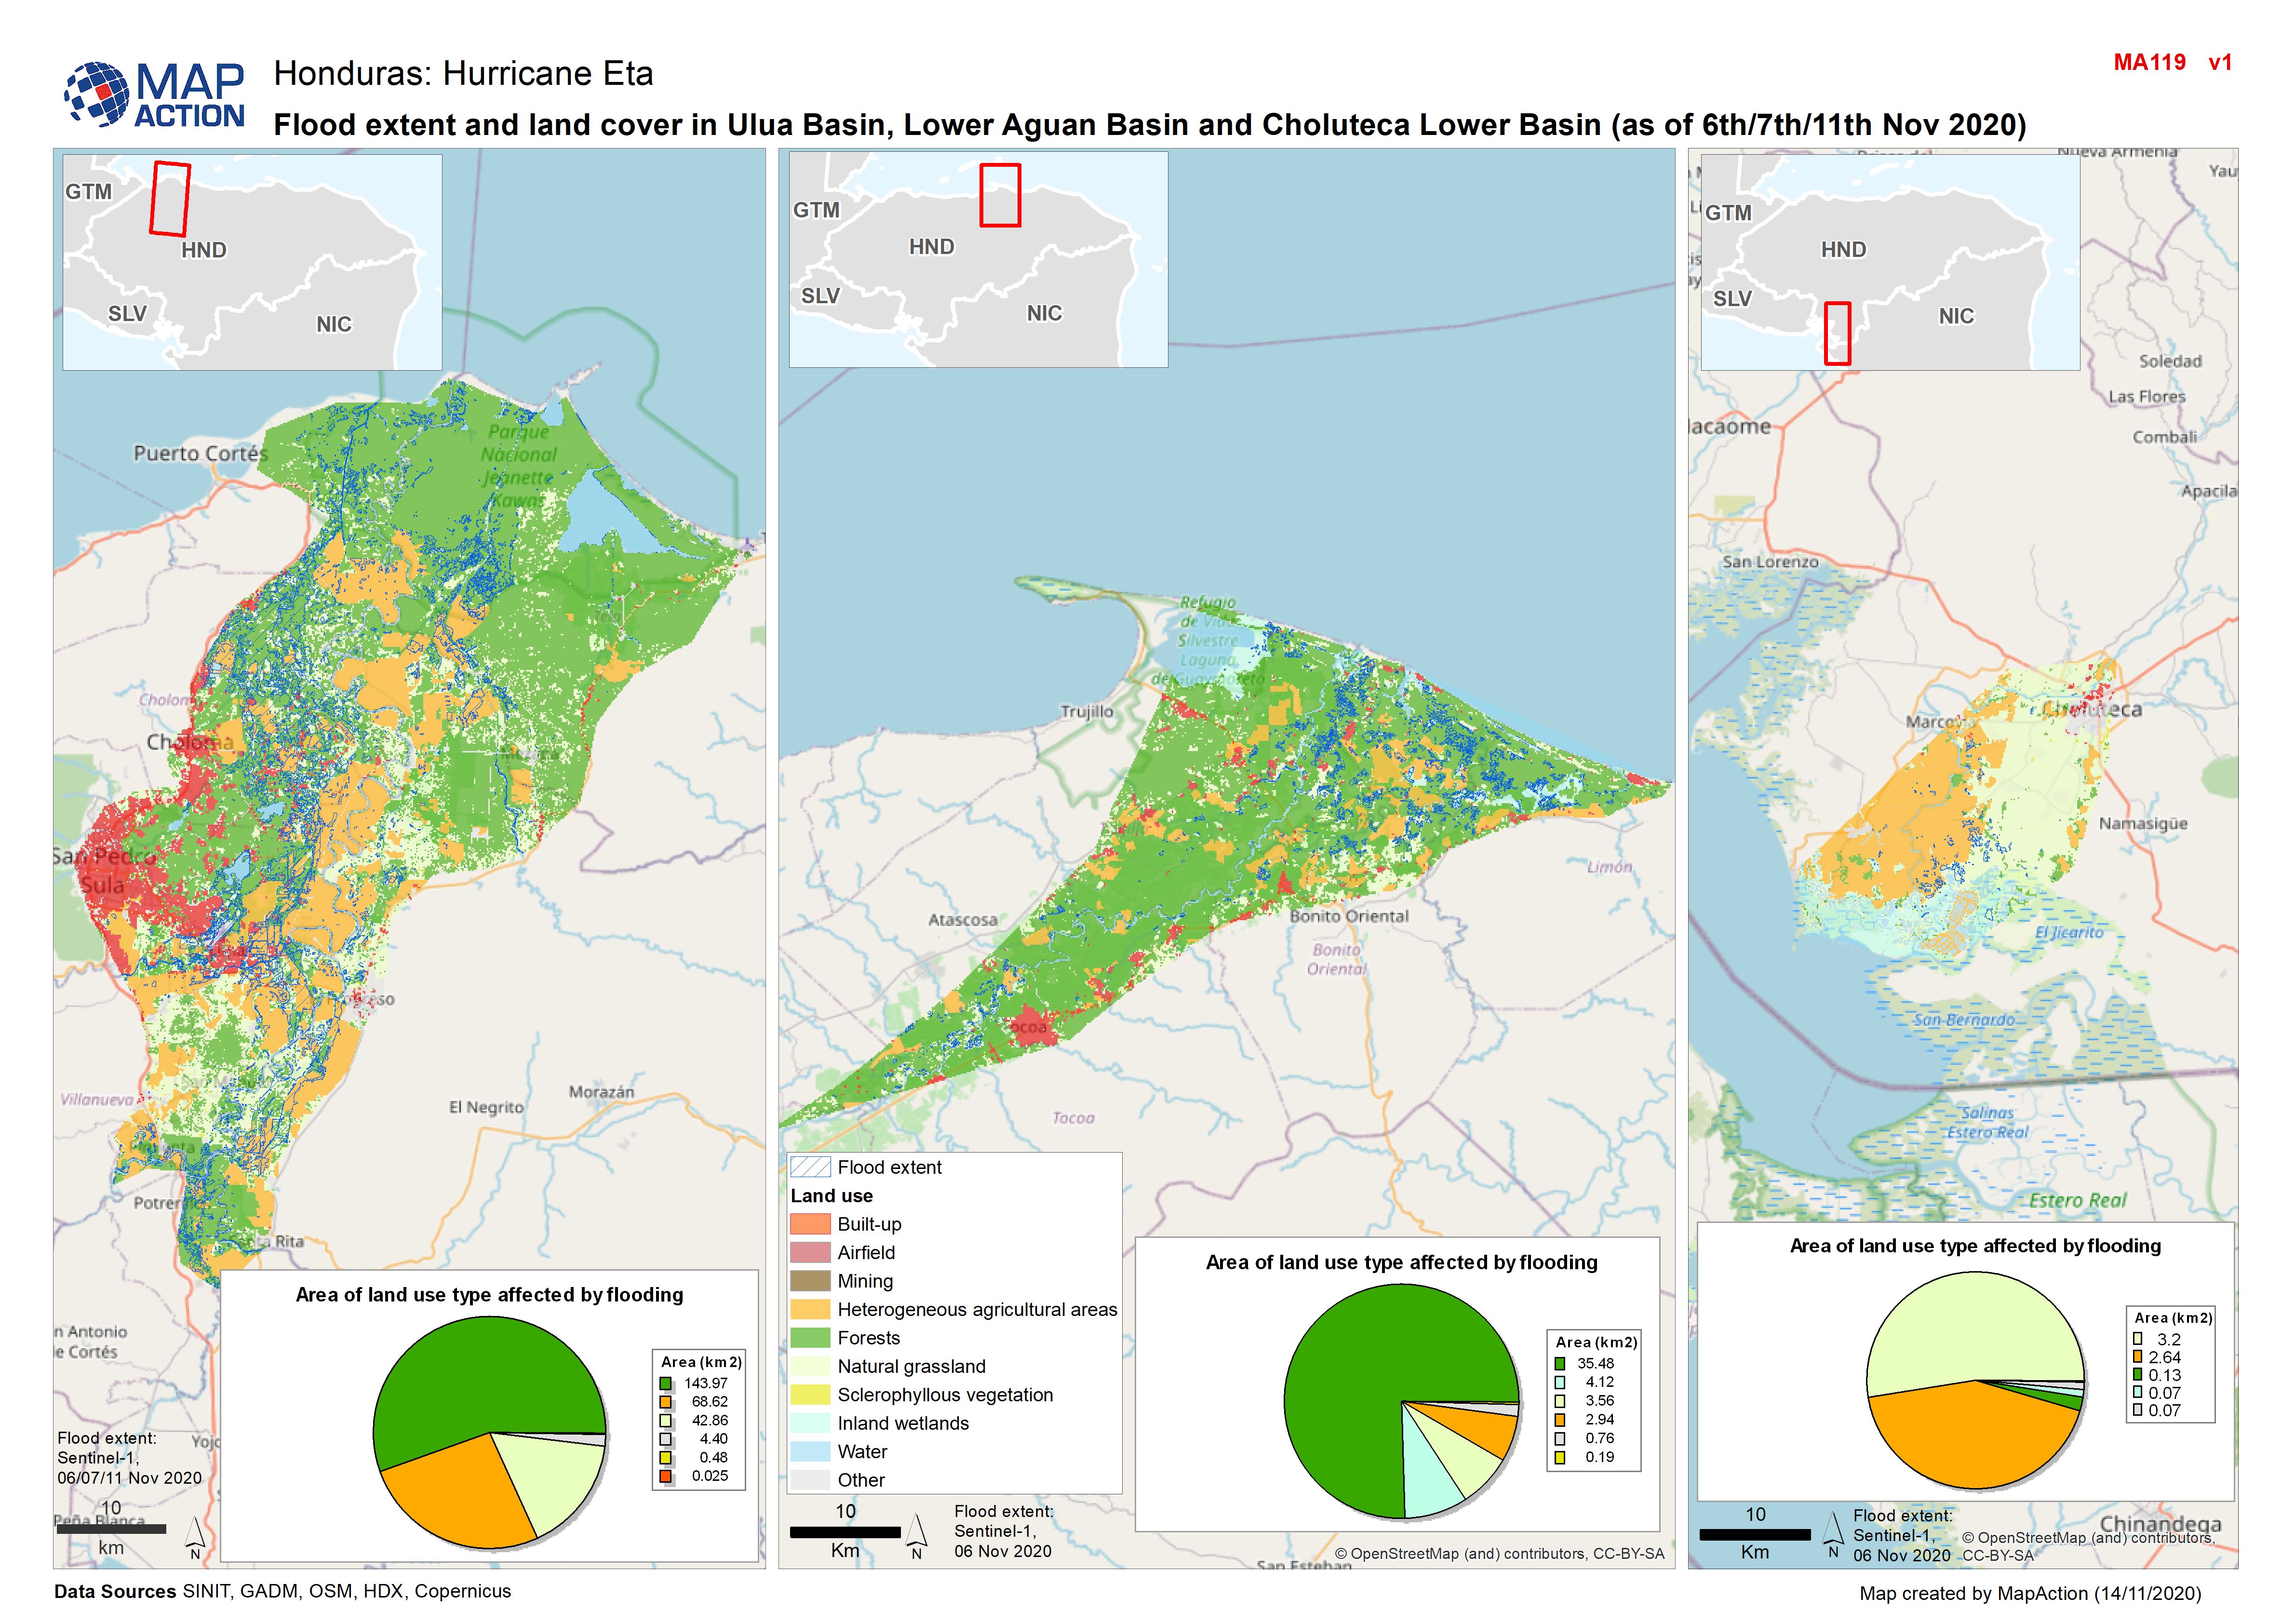
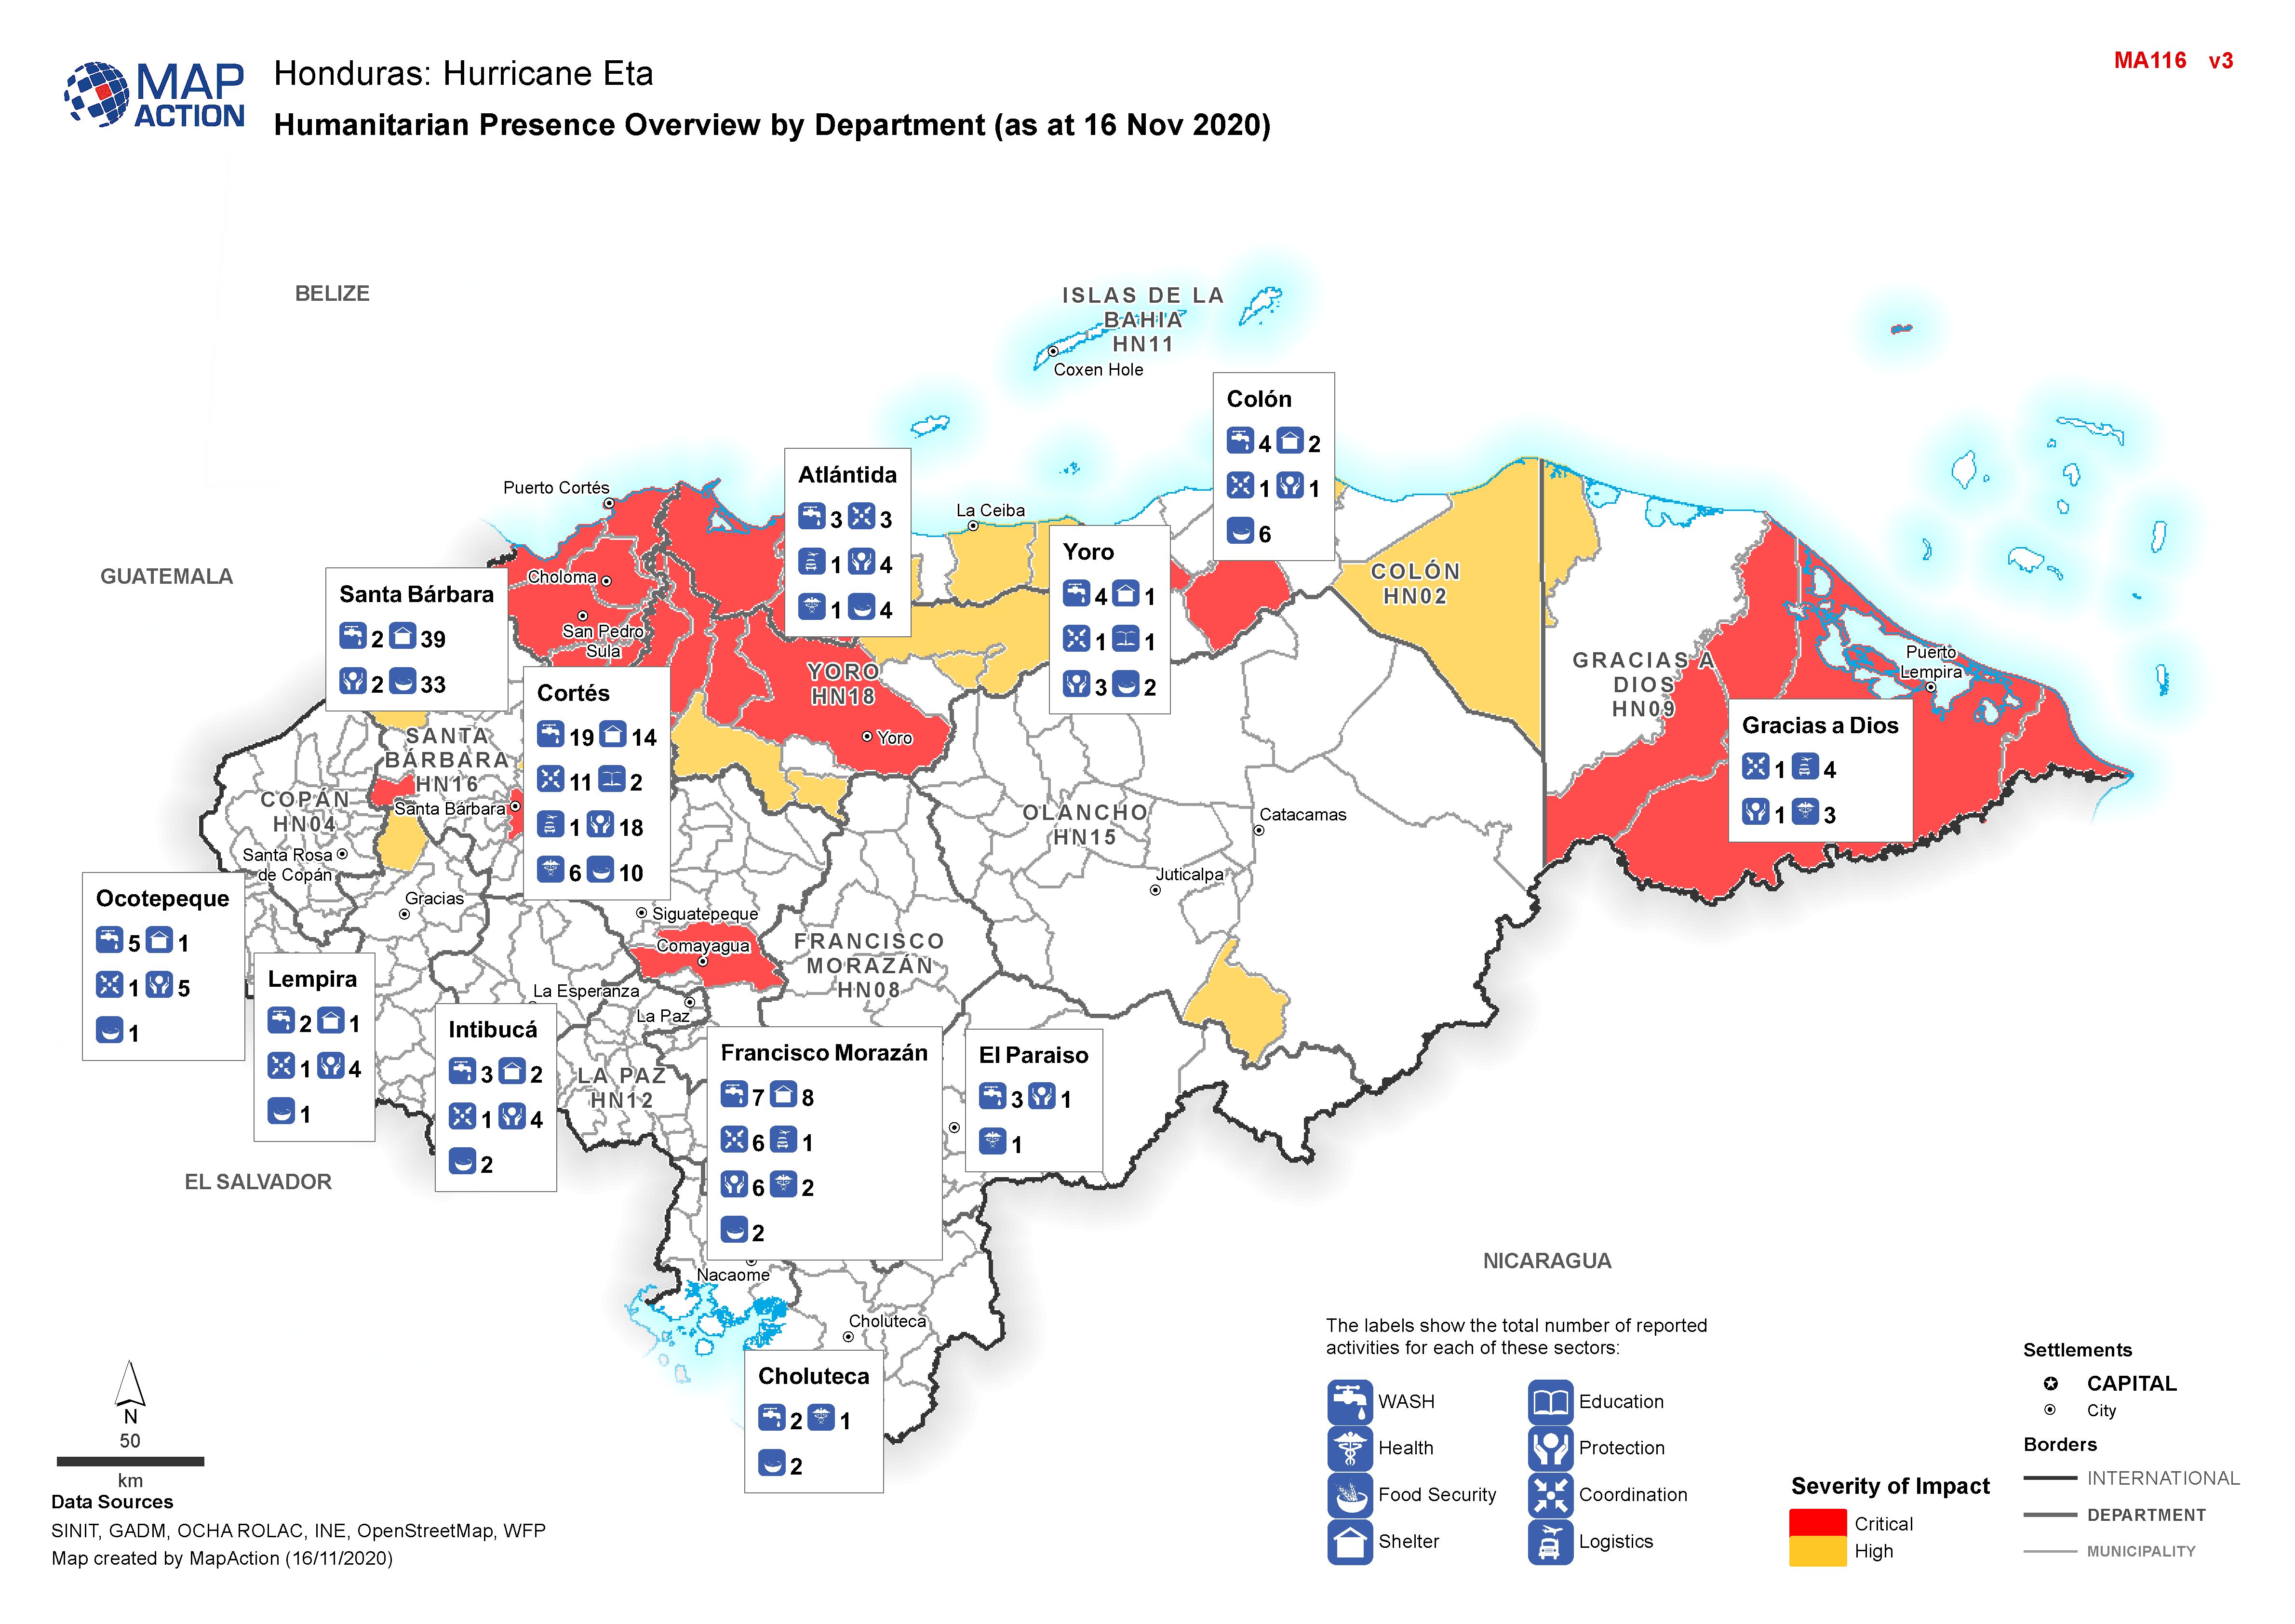
MapAction was mobilised to help the international response to the catastrophic impacts of Hurricanes Eta and Iota which have caused tremendous suffering across Central America, on top of the COVID pandemic.
A three-person MapAction team is today travelling to Guatemala following extreme flooding and catastrophic landslides in 12 of 22 of the country’s administrative departments caused by Hurricanes Eta and Iota. Ten departments have declared a state of emergency and the Guatemalan government has requested foreign assistance. Around one million Guatemalans are estimated to be directly affected and at least 53 people are known to have died.
The devastating storms have come on the back of social and economic hardship caused and exacerbated by COVID, unemployment and population displacement. The flooding has caused widespread destruction of crops and livestock and around 5,000 wells have been contaminated. There is a high risk of disease outbreak and many people are in urgent need of shelter.
The MapAction team, which is deploying at the request of the Office for Coordination of Humanitarian Affairs (OCHA), will be helping to gather and map information about the evolving situation on the ground, as well as the aid being provided by different agencies, so that gaps can be identified and addressed.
This mission brings the total number of MapAction personnel working with OCHA teams on the impacts of Eta and Iota in the Central American region to nine, with additional support from across our wider team. In addition to the Guatemalan team, a five-person MapAction team has been providing full remote emergency support to OCHA’s Regional Office for Latin America and the Caribbean (ROLAC) since 6 November and another team member has been seconded to ROLAC full time since September to assist with hurricane preparedness and other humanitarian issues across the region.
We’re grateful to the German Federal Foreign Office for supporting our response, as well as to the Netherlands Ministry of Foreign Affairs, the UK FCDO and Rotary clubs around the UK for their continued support of MapAction’s response capacity.
Countries in Central America are facing catastrophic winds and flooding as Hurricane Iota, a Category 5 storm, makes its way across Nicaragua, Honduras and El Salvador.
With wind gusts of up to 250km/hr and torrential rain, Iota made landfall in northeast Nicaragua last night. It is compounding the damage and devastation inflicted by Category 4 Hurricane Eta, which killed at least 178 people in the region a fortnight ago and destroyed food crops for thousands of families.
MapAction has been remotely providing full emergency support to the Latin American and Caribbean regional body of the UN’s Office for Coordination of Humanitarian Affairs (OCHA), known as ROLAC, since 6 November to assist the response to Eta and now Iota. This includes mapping storm tracks, flood extents, building damage, affected populations and information about what assistance humanitarian teams are already providing in different locations so that gaps can be identified and rapidly addressed. This work represents a scaling-up of the ongoing support to ROLAC we have been providing since September, in preparation for Hurricane season and other humanitarian issues across the region.
“Iota is hampering the response to Eta, severely degrading logistic routes and complicating the information picture,” said MapAction’s Operations Director Chris Davies. “Our maps are helping teams on the ground direct resources where they’re most needed, as safely as possible. We will continue to provide support to our ROLAC colleagues and are anticipating and preparing for additional requests for our assistance.”
We’re grateful to the German Federal Foreign Office for supporting our response, as well as to the Netherlands Ministry of Foreign Affairs and the UK FCDO for their continued support of MapAction’s response capacity.
Earlier this year, MapAction was asked by the UN’s Office for the Coordination of Humanitarian Affairs (OCHA) to send a team to Turkey. Their mission was to provide assistance to humanitarian teams there and in Northwest Syria who are supporting the very large numbers of refugees and internally displaced people that arrived in the region during the first three months of the year following an upsurge of fighting in Aleppo.
Days before the MapAction team was due to travel, the UK and Turkey went into lockdown. Consequently, the team was compelled to switch rapidly to a remote-working approach.
Since late March, they have been helping the Clusters to get a better understanding of the locations and sizes of the camps and the needs of the people arriving and living in them. Camps vary enormously; from just a few tents to up to 93 separate sites within a single camp, and from long-term, static settlements to temporary ones.
As well as cross referencing, checking and cleaning data about camp locations received from numerous sources, the MapAction team developed some simple tools to help do this quickly and easily in future, which will also have benefits for other areas of work undertaken by the Clusters. One tool validates the location coordinates of camps recorded by teams within Syria, another matches them to Syrian administrative areas.
The MapAction team has also been locating aerial images of the camps on OpenStreetMap and using these to develop 900 map polygons showing the shape and size of each camp. As well as helping the Clusters to understand and meet the existing needs of people in the camps, this work will help to inform them about their population densities, which is particularly important in the context of COVID-19.
Updated to add: This project was shortlisted for a DataIQ Award for ‘Best use of data by a not-for-profit’.
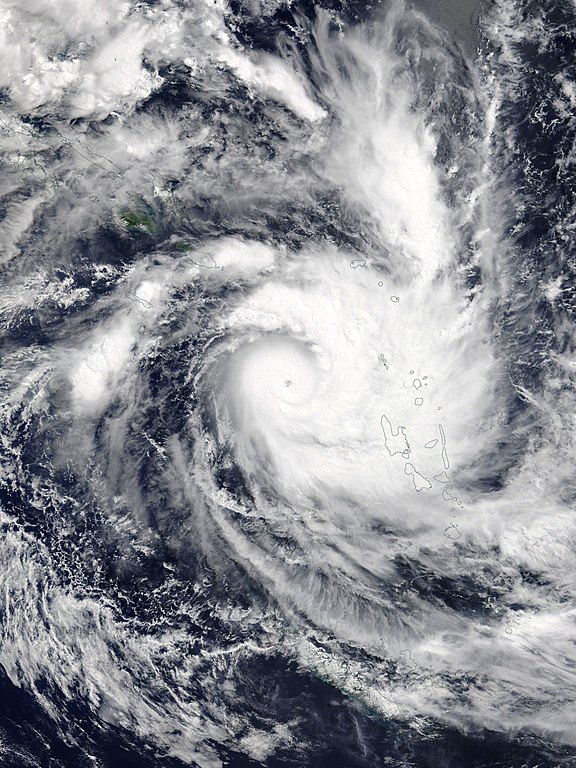
While much of the world was focused on battling COVID-19 last week, a powerful tropical cyclone swept through the Solomon Islands, Vanuatu, Fiji, and Tonga, causing significant damage and loss of life.
With gusts over 170mph and rainfall of 250-450mm, Tropical Cyclone Harold was the worse storm to hit Vanuatu since Cyclone Pam in 2015, and, in some areas, damage has been significantly worse. Entire villages are reported to have been destroyed in the northern parts of the island chain.
In addition to the devastation caused by the storm, social distancing measures had to be temporarily lifted in some areas to enable people to gather in emergency shelters, and this may exacerbate the impacts of COVID-19 in the region. Furthermore, the crisis is largely remaining under the radar, given the ongoing pandemic, meaning little funding is being made available to assist the affected islands, despite tremendous need. What international aid there is has been hampered and delayed by the virus.
MapAction is already delivering support to the UN’s Office for the Coordination of Humanitarian Affairs (OCHA) in the Asia Pacific region (ROAP) to help the regional COVID-19 response. We have diverted some of this effort to respond to the emergency caused by Cyclone Harold, creating situation maps for Fiji and Tonga. These are helping humanitarian teams prioritise and coordinate aid. We will continue to provide assistance as needed.