MapAction has signed the Standby Partnership Agreement with the World Health Organisation (WHO) which will allow the UK-based emergency response and disaster preparedness charity to have greater impact in health emergencies.
The agreement will see MapAction volunteers ready on standby to deploy to any health emergency operations at the request of the WHO. This will help bring the organisation’s unique data-driven approach to saving lives in even more health crises worldwide.
The Standby Partnership Agreement will streamline and simplify how MapAction can deploy to WHO emergency operations at short notice. The agreement states that MapAction will “maintain a roster of standby personnel….for the rapid mobilisation and deployment of pre-screened individuals…to WHO emergency operations.”
“We will provide some surge support that will be relevant to WHO emergency operations,” MapAction’s CEO Liz Hughes says of the agreement, noting that it is an important step to being able to deploy faster and more efficiently alongside WHO teams in emergency operations. “We have a growing knowledge of health needs through our own work” adds MapAction’s CEO.
MapAction has already lent data management, geospatial and mapping support in 13 health-related emergency deployments worldwide since 2014. Teams of volunteers from the Oxfordshire-based charity were involved in providing support in the Ebola crisis in West Africa, as well as during the more recent COVID-19 pandemic. A team of MapAction volunteers is also currently working on a project to reduce the impacts of cholera in Malawi.
Besides deployments to emergency health crises, MapAction has also developed, with partners, the Integrated Humanitarian Data Package (IHDP) tool, designed to aid final mile vaccine delivery planning and logistics. It contains selected data sets, information explaining the data (‘metadata’) as well as GIS and coding tools which allow users to easily develop situation-specific items such as maps and other graphics.
The IHDP was trialled during the roll out of COVID-19 vaccines in South Sudan.
It was adapted in Burundi in late 2022 to combat the impacts of malaria.
In March 2020, MapAction and the UN OCHA (Office for the Coordination of Humanitarian Affairs) Centre for Humanitarian Data embarked on a new level of collaboration by sharing a Data Scientist’s time between the two organisations. Both teams had a lot to offer and learn from each other, with MapAction bringing its geospatial expertise to the Centre’s Predictive Analytics (PA) team. Predictive analytics is a form of data science that uses current and historical facts to predict future events. For MapAction, this collaboration also constituted an important aspect of our Moonshot, which sees us transitioning from being a passive data consumer to an organisation that actively contributes to humanitarian datasets.
2020 Highlights
Looking back on our work over the past year, we can see how this collaboration has benefitted both organisations in many ways, with numerous positive repercussions more widely. Ultimately, the fruits of our joint working are examples of how data science can help to reduce suffering and save lives in humanitarian initiatives.
“Your input leap-frogged us forward. It is amazing to me how quickly we were able to do this together. A round of applause for your work and its contribution to unlocking critically needed aid for Ethiopians.“
Josée Poirier, Predictive Analytics Technical Specialist, Centre for Humanitarian Data
Preventing hunger
In the latter part of the year, a MapAction team of volunteers helped the Centre’s PA team develop analysis for a drought-related anticipatory action framework which was designed to trigger mitigation activities ahead of a predicted drought crisis. The PA team aimed to better understand the reliability of various indicators used to predict potential food shortages caused by drought in Somalia and Ethiopia. These indicators were then used to trigger an early release of funds from the UN’s Central Emergency Response Fund (CERF). The MapAction team reviewed past literature, evaluated available satellite images, and created a prototype drought model in Google Earth Engine (a platform for visualising and analysing satellite imagery of Earth). These inputs helped the PA team to flag an upcoming crisis in Ethiopia and trigger an activation for a humanitarian response. In the words of Josée Poirier, Predictive Analytics Technical Specialist from the PA team: “Your input leap-frogged us forward. It is amazing to me how quickly we were able to do this together. A round of applause for your work and its contribution to unlocking critically needed aid for Ethiopians.”
Flood mapping
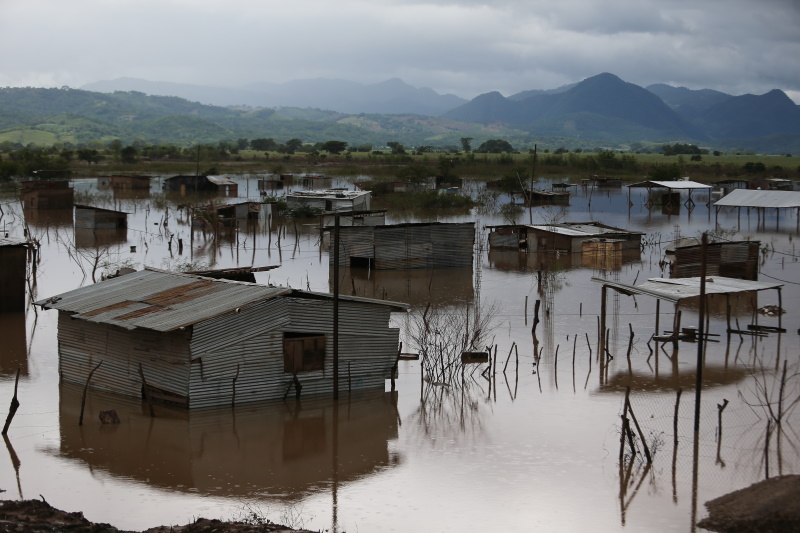
The MapAction and PA teams also collaborated to implement and validate an approach for mapping flooding from satellite imagery. MapAction’s Data Scientist has been working with the PA team to help evaluate the impact of recent anticipatory action in Bangladesh which took place in July 2020 and was the fastest-ever allocation of CERF funds. To better understand how this aid was helpful to those affected, the PA team needs to know exactly when, where, and for how long flooding occurred. Contributing to this work also has direct benefits for MapAction’s own work, enabling us to add a new data processing method to our disaster-response toolbox. We then had the opportunity to test this methodology in our response to the devastating impacts of Hurricanes Eta and Iota in Central America.
MapAction was able to test the flood-mapping methodology developed with the Centre for Humanitarian Data in the response to Hurricanes Eta and Iota in Central America. Photo: European Union, 2020 (D Membreño)
COVID-19
Both organisations have made commitments to assist in the global pandemic response. The Centre PA team and MapAction Data Scientist have, in partnership with the Johns Hopkins University Applied Physics Laboratory (APL), developed a model to forecast the number of cases, hospitalisations, and deaths due to COVID-19 for six countries, tailored to each country’s specific humanitarian needs. Named OCHA-Bucky, the model offers sub-national projections, and takes into the account the effects of non-pharmaceutical interventions. Presently, MapAction is participating in a pilot project to aid vaccine rollout in vulnerable countries by surveying the current data landscapes and identify gaps in order to address the logistical challenges inherent in such tasks. Along a similar line of work, the Centre PA team and APL are planning on adding vaccination strategies to the OCHA-Bucky model.
Projected total infections per 100,000 inhabitants in Afghanistan on 2020-08-03. Projections were obtained by simulating local transmission in each district in Afghanistan and expected spatial and temporal spread between districts. Country-specific risk factors were included in the simulation at the subnational level.
Shared goals
There is substantial overlap between the broad technical goals of the two organisations. The Centre’s Humanitarian Data Exchange (HDX) contains over 18,000 datasets and it has created several automatic pipelines (software that carries out a series of data-processing steps) to systematically ingest data from its partners into its database. The Centre’s technical expertise has so far been a key input into the planning and development of a similar (albeit smaller scale) pipeline at MapAction, which is being created to automate the generation of core maps as part of the Moonshot initiative. This work will ensure that base maps essential for coordinating any type of humanitarian response are immediately available whenever they are needed.
The two organisations share similar data access platforms and are actively engaged in ongoing discussions regarding different ways to construct pipeline software. Finally, both HDX and MapAction ultimately seek to identify and rectify gaps in the humanitarian data landscape in order to ensure that those coordinating the preparations for and responses to different types of emergencies have the reliable, timely information they need.
Looking ahead in 2021
MapAction and the Centre for Humanitarian Data are continuing to plan ways to collaborate throughout the rest of the year and beyond.
In addition to sharing expertise in advanced analytics, we are working to make data-driven methods accessible to wider audiences in the humanitarian sector in order to improve the effectiveness of aid programmes. MapAction and the Centre’s Data Literacy team have identified an opportunity to come together to develop GIS training material. This work aims to help non-technical humanitarians make better use of geospatial data to understand the needs of affected communities and coordinate aid.
Both teams are also collaborating to ensure that our data science workflows and models are published openly and can be used by others in the field. Inspired by initiatives such as The Turing Way, we are formalising and adopting best practices to write high quality code, document methodologies, and reproduce results.
At the end of the first year of our collaboration, it is gratifying to reflect on how much we have been able to achieve together while learning from each other and expanding our collective knowledge. We’re grateful to the German Federal Foreign Office for making this work possible by funding our Data Scientist role. We’re looking forward to continuing to work together to push forward the boundaries of humanitarian data science.
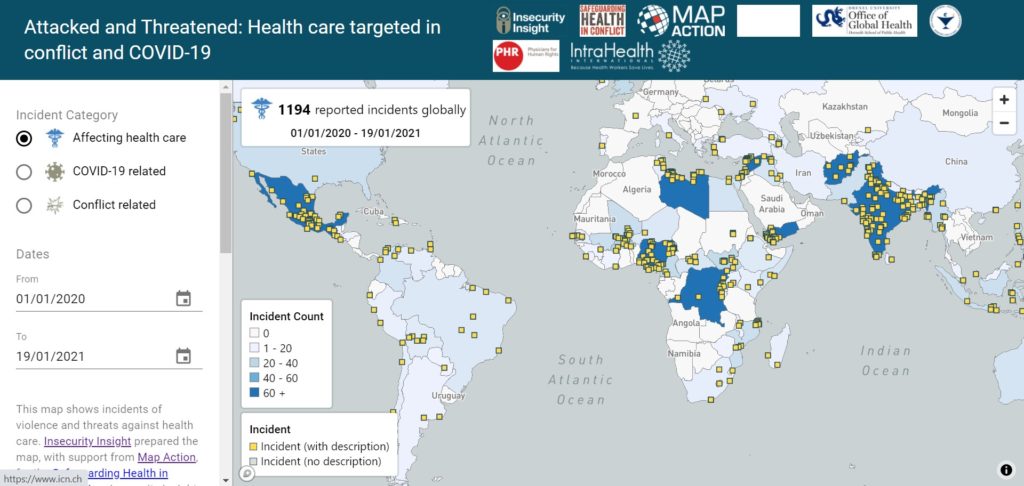
The increase in the number of security incidents affecting healthcare workers during the COVID-19 pandemic has been highlighted in an interactive web map launched today.
Incidents include the arson of COVID-19 testing facilities, the targeting of health workers on their way home from clinics, and violent responses to mask requirements.
Developed by Insecurity Insight, a non-profit which works to examine threats facing those living and working in dangerous environments, and MapAction, the user-friendly map is intended to support the aims of the Safeguarding Health In Conflict Coalition.
Christina Wille, Managing Director, Insecurity Insight, commented, “This tool gives stakeholders concerned with the protection of health care global insight into COVID-related incidents of threats and violence against health care providers to support better protection of health workers.”
The map depicts 412 acts of pandemic-related violence and threats to health workers and services around the world in 2020 out of a total of 1,172 incidents. Because not all incidents are reported or recorded, the actual number is likely to have been significantly higher.
To create the map, MapAction needed to consolidate the data available – which is often in indigestible formats and from multiple sources – understand the geographical context and visualise it. We brought our considerable experience in humanitarian mapping, information management, and solution design to the project, ensuring the information architecture is a stable platform that is easy to manage, while allowing for future adaptations and enhancements to be seamlessly integrated.
Christina continued, “We are working with MapAction to expand the map’s functionality and develop a similar tool for the education sector and other areas, as well as a map on security incidents affecting aid operations in Mozambique.”
MapAction is working in close collaboration with our partner CartONG to provide GIS & information management support to UNICEF – another long-term MapAction partner – on an as-needed basis around the world.
Working with UNICEF’s head quarters, country offices and partners in different parts of the globe, we are focusing on helping with geospatial data collection and management, mapping, knowledge management and capacity building.
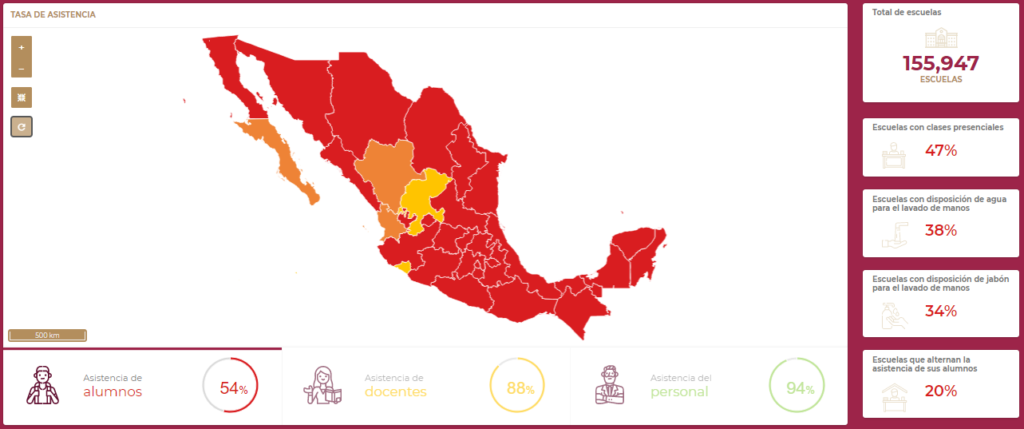
One of the projects we have been collectively working on is a data analysis dashboard to help educators in Mexico respond to the COVID-19 pandemic. This dashboard, which is updated on a daily basis, is a dynamic, interactive visualisation of information enabling education teams to monitor changes and identify trends in school attendance following COVID closures. It also provides general information on the state of schools’ water and sanitation infrastructure.
Screenshot of the dashboard showing sample data
The dashboard is currently in beta. When finalised, it is planned that all teachers across Mexico will have access to it to help them plan and respond to the evolving COVID crisis.
As well as helping CartONG to build the dashboard, MapAction has provided data processing scripts to ensure a seamless feed of data and has lead on the user testing and quality assurance aspects of the project.
MapAction has been collaborating for a number of years with French NGO and fellow humanitarian information management specialists CartONG.
In addition to our operational activities, we thought it would be worthwhile to pool our collective knowledge to create an informative article. The ten-minute read aims to give some helpful tips for people creating maps intended to assist humanitarian responses to the Corona virus and other pandemics.
Between us, we have a lot of experience of using geospatial analysis and visualisations to inform decision-making in this and previous epidemics, such as Ebola, as well as the current pandemic. We wanted to share this knowledge more widely and felt that, by working together, we could create something really useful and reach more people. Although it was written with pandemics in mind, many of the points apply to all kinds of map making.
You can read the article on the CartONG blog below.
This project was co-funded by the French Development Agency (AFD) and the H2H Network’s H2H Fund, the latter supported by UK aid from the UK government.
The Voluntary and Community Sector Emergencies Partnership (VCS EP) is leading a collaborative initiative to establish a UK-wide coordination system for civil society organisations and charities participating in the country’s domestic response to COVID-19. It aims to provide support to people in vulnerable situations who aren’t able to get help locally. The initiative, which is backed by the UK government, is a huge undertaking and draws on expertise from a broad range of people and organisations.
The concept is based on a number of ‘tactical cells’ located around the four countries of the UK and made up of experts from across the voluntary and community sector.
These cells will oversee, coordinate and represent the voluntary and community sector’s response to Covid19. Each cell aims to identify the unmet need of people in the most vulnerable situations by linking information gathered from teams delivering front-line support to strategic decision makers. This rapidly changing information is used to ensure resources go to where they are most needed, for example by identifying where demand for support outweighs the local capacity available, or where needs are of a particularly specialist nature.
A four-person MapAction team has been supporting the VCS EP to set up, test and run the information flows and coordination systems for the tactical cells. Our input was solicited because of our team’s experience and knowledge of the challenges of creating and delivering a robust information management process across multiple countries in a complex and rapidly evolving crisis situation.
The VCS EP is co-chaired by the British Red Cross and the National Association for Voluntary and Community Action (NAVCA).
The new system is being rolled out this week and will be in place for the rest of the spring and summer.
MapAction has been helping its partners the World Food Program (WFP) and Caribbean Disaster Emergency Management Agency (CDEMA) to distribute mobile app questionnaires about availability of and access to food during the COVID-19 pandemic.
Over the past several years, we have been working with CDEMA and other organisations to build a network of GIS professionals in the Caribbean region (and elsewhere) with a shared interest in disaster preparedness and information management. We were able to use this network to help disseminate the questionnaire as widely as possible across the region in order to gather information about potential food shortages once incidences of the virus escalate.
A MapAction team member currently based in New Zealand is providing GIS, mapping and information management support to the UN Office for Coordination of Humanitarian Affairs (OCHA) in Asia and the Pacific (ROAP).
Over the next two months, he will be helping ROAP to support countries that have limited public health infrastructure and resources to cope with the rapid onset of COVID-19. He will be assisted in this work by MapAction’s team of volunteers.
ROAP covers 41 countries in Asia and the Pacific and currently supports these countries in their efforts to ramp up preparedness and response through the UN Resident Coordinators and their offices, as well as local governments.
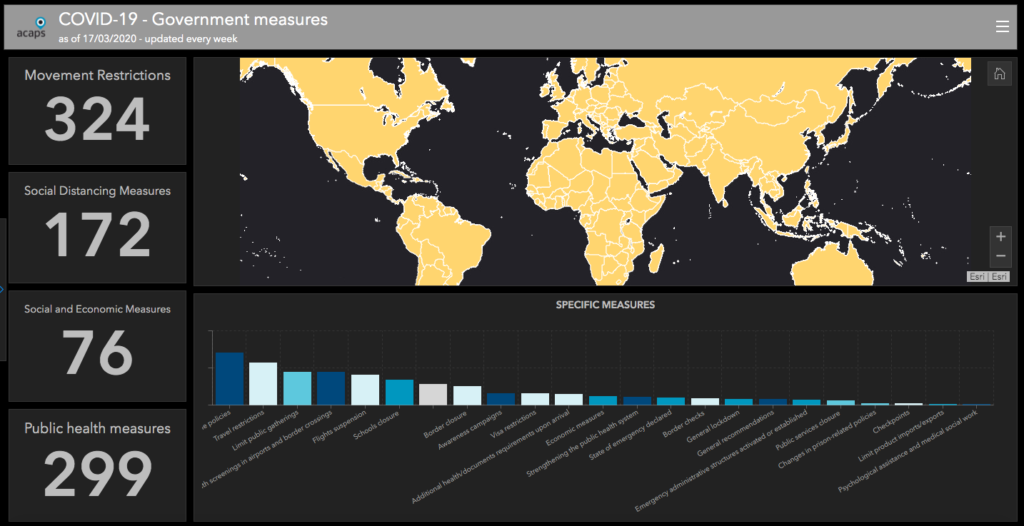
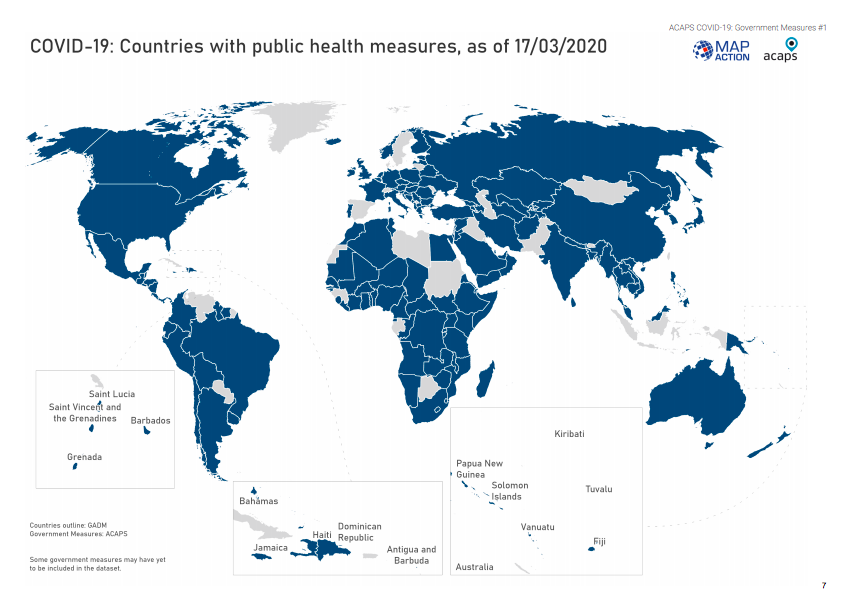
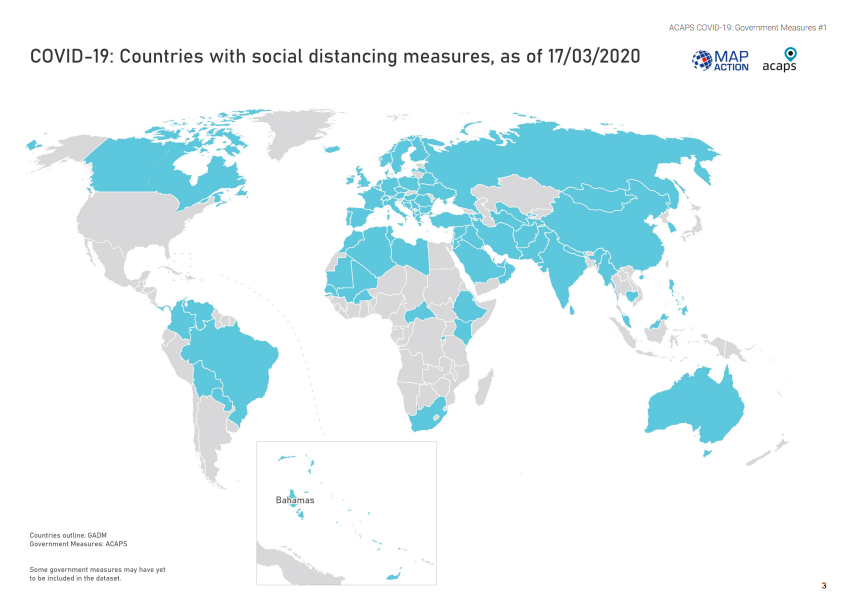
We’ve helped ACAPS to put together a dashboard showing government measures being taken around the world. Data can be filtered by region, country, type of measure and timeframe.
We will be updating this twice a week. In the meantime ACAPS, MapAction and other organisations are looking at further topics to develop analysis for.
The first bulletin in a series about measures adopted by governments in response to COVID-19, as well as potential impacts on ongoing humanitarian operations, has now been published by ACAPS.
MapAction is collaborating with ACAPS and other partners to provide analysis, maps and visualisations of the pandemic as it evolves to assist governments and aid agencies in their response.
Since last week, we have been working with our partner ACAPS, the independent humanitarian analysis organisation, to support their efforts looking at the longer term humanitarian effects of COVID-19.
Every Wednesday, starting today, ACAPS will be publishing a weekly bulletin about government measures around the world in relation to the virus. MapAction is assisting this work with analysis, mapping and visualisations of the collected data. The data is also being published via the Humanitarian Data Exchange (HDX).
This information will enable teams planning the response to the pandemic around the world to see what steps are being taken in different countries and what the impacts of those measures are.