At the height of the COVID-19 pandemic, many parts of the world came to a standstill. Workplaces and schools were forced to shut down in a bid to contain the spread of the virus. In Mexico schools were closed in March 2020 and as with many countries, students moved from time in the classroom to online learning and homeschooling.
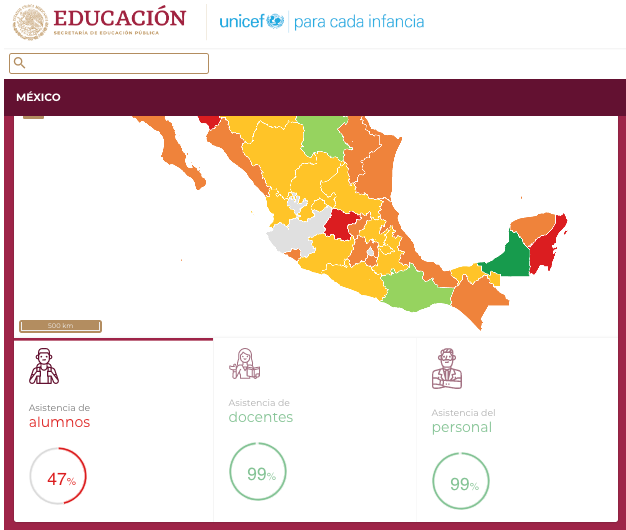
As COVID restrictions were lifted, the Mexican Ministry of Education needed to track the progress of schools reopening across the country. A dashboard was required to show schools across the whole of the country gradually opening post-COVID restrictions.
During crises, data visualisation has a vital role in making sense of complex environments and needs. That’s why MapAction is increasingly being asked for different types of data visualisation and geospatial information tools, such as this dashboard.
Under a long-term service agreement between UNICEF, MapAction and CartONG, UNICEF Mexico requested support for the Mexican Ministry of Education for the system. Together we created the dashboard.
It was created to display and monitor real-time information on key education indicators for all elementary schools. This relied on over 200,000 individual schools uploading their data on a daily basis, and was the first time that this information would be collected and displayed at a national level.
Originally considered as a monitoring and decision-making tool for head teachers and officials, it was amended to be designed for the public, requiring changes to the underlying infrastructure.
The finished dashboard included the quantity of children and teachers returning and trend analysis. As no safe water assessments had been carried out on a country-level since 2013, it also included the supply of safe water facilities.
MapAction carried out the development, setup and support on all the Azure Cloud infrastructure (the back-end part of the development of the dashboard). In addition, MapAction also handled all technical communications with the Ministry of Education’s database engineers, and was in charge of running a series of key tests (Quality Assurance, User Acceptance test, automated system tests, etc.), with the support of CartONG’s team. Among the tasks carried out by CartONG was the development of the front-end of the dashboard. It was imperative for making it user-friendly so that it could be accessible for a diverse range of users. The collaboration between MapAction and CartONG meant that the dashboard was technically effective, whilst also being easy to use. The dashboard has proven a useful tool for the Ministry of Education, and allowed the transition back to school to be as smooth as possible. The overall feedback from both the Ministry and Unicef Mexico has been positive.
COVID-19 has been tough for all of us but the development of COVID-19 vaccines should offer a lifeline to the whole world. However, for many, especially those in the world’s poorer countries, it’s yet to make an impact.
As part of the drive to provide equitable access to vaccines, international agencies involved in COVAX need to ensure that countries are ready to accept delivery and coordinate the roll-out.
With this in mind, MapAction, with funding from the Calleva Foundation, partnered with expert geospatial colleagues from CartONG, OpenMap Development Tanzania, the Humanitarian OpenStreetMap Team, Afrimapr/LSTHM, Mapbox and Esri, to create a novel concept called the Integrated Humanitarian Data Package (IHDP). This aims to give quick and easy access to key geographic data that underpins the planning and delivery of vaccination programmes.
The single package contains not only selected data sets, but also information explaining the data (‘metadata’), together with a set of GIS (geographic information system) and coding tools to easily develop situation-specific items such as maps and other graphics, depending on user-need. This will give organisations managing vaccine delivery in vulnerable countries a running start, once vaccines become available.
Nick McWilliam, IHDP project lead at MapAction said, “High quality mapping and data analysis are key to understanding how many people need vaccinating, where they are, and how and where the vaccines can be safely stored and delivered. We know that access to good data is a major issue in many countries. Even where data exists, it’s frequently patchy and not in a format that is usable by most people, as well as lacking crucial information about the local context. The IHDP concept is intended to remove barriers to good information that are otherwise likely to hinder vaccine delivery.”
The pilot project focused on creating an IHDP for South Sudan, however, the lessons learned are applicable across many other countries where population information is often too poor for effective logistics.
The IHDP is designed to be used by non-GIS experts with coordination and management responsibilities and ensures that they can easily use good quality data in a readily usable format. It’s also designed to reduce the time and effort needed, removing barriers for responders so they can quickly understand and respond to often complex situations.
“The COVID-19 pandemic created unprecedented demand for data in the humanitarian sector, but persistent data gaps remain. With every country in the world affected by COVID-19, the disparity in data availability in countries experiencing humanitarian crises became more clear.”
The State of Open Humanitarian Data, 2021: Assessing Data Availability Across Humanitarian Crises. OCHA Centre for Humanitarian Data and Humanitarian Data Exchange
We are also sharing this information amongst the humanitarian community and international agencies involved in the COVID-19 vaccine roll-out.
See a video interview with Nick McWilliam, IHDP Project Lead.
So far, the COVID-19 pandemic has reportedly caused 214 million illnesses and killed nearly four and a half million people worldwide (Google statistics). The impact on the poorest and most vulnerable people is immense, especially where populations are already facing several humanitarian crises.
MapAction has been working with GIMAC (the Global Information Management, Assessment & Analysis Cell) which was set up by several UN agencies and other international bodies to coordinate, collate, manage and analyse COVID-19 related information. The organisation also established a ‘field support’ mechanism, available to 25 countries currently implementing a Humanitarian Response Plan. On the ground, this meant providing technical support to a number of countries already facing significant ongoing humanitarian problems and keen to update their plans in light of Covid-19.
MapAction’s role was initially funded by the H2H network, and saw us assimilating the rapid data collection to provide GIS mapping and spatial analysis to support good decision-making. To do this, one of our team was seconded to the programme for two days a week.
As well as helping to gather initial data, we also used our GIS skills to provide mapping and other visualisations to countries on an open source basis.
Our work on the programme is now coming to a close but throughout our time on the programme, we provided extensive geospatial analysis and data visualisation support. Overall we produced and provided around 60 maps and graphics on the impacts of the virus and any secondary shocks, alongside the ongoing humanitarian crises. These included baseline populations, food security levels, public security and educational accessibility.
Fawad Hussain, GIMAC Coordinator, OCHA, said, “MapAction has provided exceptional support to GIMAC and the country teams and it has been a pleasure to work with Matt and other MapAction colleagues.”
Administering billions of shots of COVID-19 vaccine around the world is a logistical challenge of unprecedented proportions. It is even more complex in countries lacking basic healthcare infrastructure, cold storage or comprehensive transport networks, or where accurate population information is not available.
Understanding how geospatial analysis can help, MapAction is partnering with other geographic information specialists to help coordinate the delivery of COVID-19 vaccines in 15 low-income countries with acute humanitarian needs.
The Geographic Information Management Initiative for COVID-19 Vaccine Delivery (GIM Initiative), which launches today, aims to help local partners tackle critical issues such as the selection of distribution sites, the planning of healthcare workers’ journeys to remote locations when no up-to-date maps exist, how to record doses and follow up with vaccinated people, and challenges around accessing the most vulnerable communities, including settlements that aren’t yet mapped.
MapAction is joined in the GIM Initiative by Alcis, CartONG, Humanitarian OpenStreetMap and iMMAP.
In March 2020, MapAction and the UN OCHA (Office for the Coordination of Humanitarian Affairs) Centre for Humanitarian Data embarked on a new level of collaboration by sharing a Data Scientist’s time between the two organisations. Both teams had a lot to offer and learn from each other, with MapAction bringing its geospatial expertise to the Centre’s Predictive Analytics (PA) team. Predictive analytics is a form of data science that uses current and historical facts to predict future events. For MapAction, this collaboration also constituted an important aspect of our Moonshot, which sees us transitioning from being a passive data consumer to an organisation that actively contributes to humanitarian datasets.
2020 Highlights
Looking back on our work over the past year, we can see how this collaboration has benefitted both organisations in many ways, with numerous positive repercussions more widely. Ultimately, the fruits of our joint working are examples of how data science can help to reduce suffering and save lives in humanitarian initiatives.
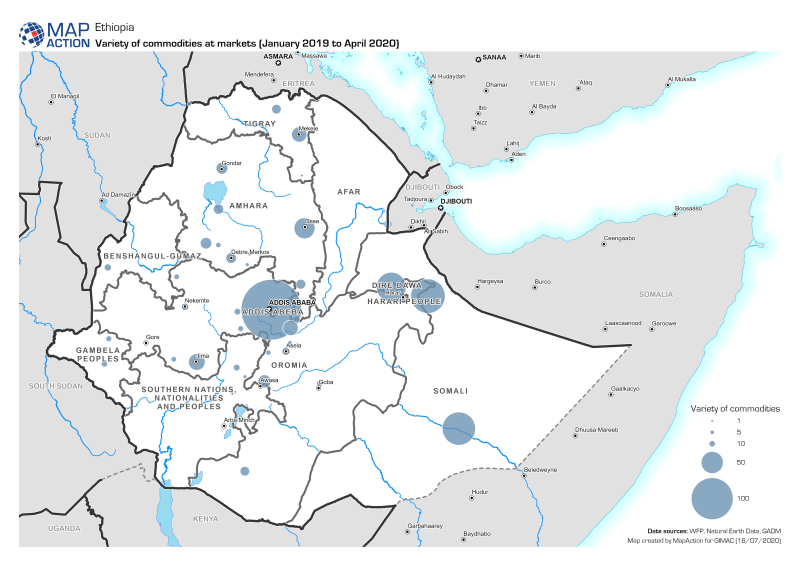
“Your input leap-frogged us forward. It is amazing to me how quickly we were able to do this together. A round of applause for your work and its contribution to unlocking critically needed aid for Ethiopians.“
Josée Poirier, Predictive Analytics Technical Specialist, Centre for Humanitarian Data
Preventing hunger
In the latter part of the year, a MapAction team of volunteers helped the Centre’s PA team develop analysis for a drought-related anticipatory action framework which was designed to trigger mitigation activities ahead of a predicted drought crisis. The PA team aimed to better understand the reliability of various indicators used to predict potential food shortages caused by drought in Somalia and Ethiopia. These indicators were then used to trigger an early release of funds from the UN’s Central Emergency Response Fund (CERF). The MapAction team reviewed past literature, evaluated available satellite images, and created a prototype drought model in Google Earth Engine (a platform for visualising and analysing satellite imagery of Earth). These inputs helped the PA team to flag an upcoming crisis in Ethiopia and trigger an activation for a humanitarian response. In the words of Josée Poirier, Predictive Analytics Technical Specialist from the PA team: “Your input leap-frogged us forward. It is amazing to me how quickly we were able to do this together. A round of applause for your work and its contribution to unlocking critically needed aid for Ethiopians.”
Flood mapping
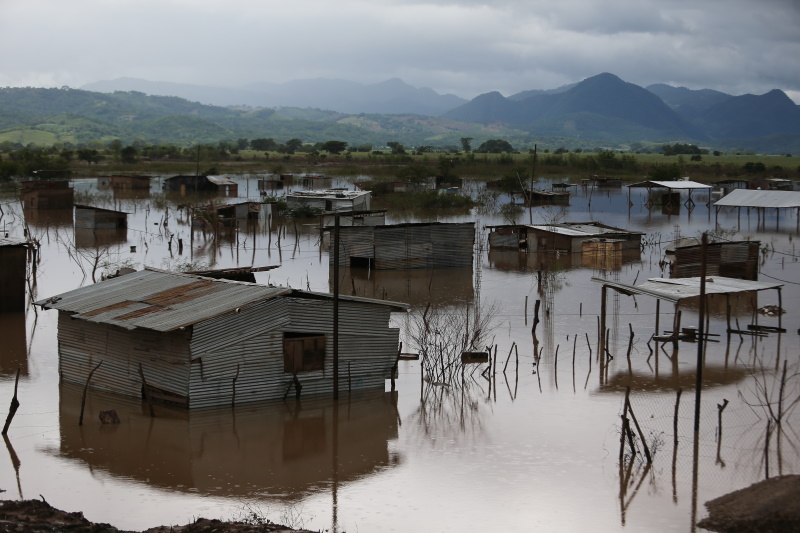
The MapAction and PA teams also collaborated to implement and validate an approach for mapping flooding from satellite imagery. MapAction’s Data Scientist has been working with the PA team to help evaluate the impact of recent anticipatory action in Bangladesh which took place in July 2020 and was the fastest-ever allocation of CERF funds. To better understand how this aid was helpful to those affected, the PA team needs to know exactly when, where, and for how long flooding occurred. Contributing to this work also has direct benefits for MapAction’s own work, enabling us to add a new data processing method to our disaster-response toolbox. We then had the opportunity to test this methodology in our response to the devastating impacts of Hurricanes Eta and Iota in Central America.
MapAction was able to test the flood-mapping methodology developed with the Centre for Humanitarian Data in the response to Hurricanes Eta and Iota in Central America. Photo: European Union, 2020 (D Membreño)
COVID-19
Both organisations have made commitments to assist in the global pandemic response. The Centre PA team and MapAction Data Scientist have, in partnership with the Johns Hopkins University Applied Physics Laboratory (APL), developed a model to forecast the number of cases, hospitalisations, and deaths due to COVID-19 for six countries, tailored to each country’s specific humanitarian needs. Named OCHA-Bucky, the model offers sub-national projections, and takes into the account the effects of non-pharmaceutical interventions. Presently, MapAction is participating in a pilot project to aid vaccine rollout in vulnerable countries by surveying the current data landscapes and identify gaps in order to address the logistical challenges inherent in such tasks. Along a similar line of work, the Centre PA team and APL are planning on adding vaccination strategies to the OCHA-Bucky model.
Projected total infections per 100,000 inhabitants in Afghanistan on 2020-08-03. Projections were obtained by simulating local transmission in each district in Afghanistan and expected spatial and temporal spread between districts. Country-specific risk factors were included in the simulation at the subnational level.
Shared goals
There is substantial overlap between the broad technical goals of the two organisations. The Centre’s Humanitarian Data Exchange (HDX) contains over 18,000 datasets and it has created several automatic pipelines (software that carries out a series of data-processing steps) to systematically ingest data from its partners into its database. The Centre’s technical expertise has so far been a key input into the planning and development of a similar (albeit smaller scale) pipeline at MapAction, which is being created to automate the generation of core maps as part of the Moonshot initiative. This work will ensure that base maps essential for coordinating any type of humanitarian response are immediately available whenever they are needed.
The two organisations share similar data access platforms and are actively engaged in ongoing discussions regarding different ways to construct pipeline software. Finally, both HDX and MapAction ultimately seek to identify and rectify gaps in the humanitarian data landscape in order to ensure that those coordinating the preparations for and responses to different types of emergencies have the reliable, timely information they need.
Looking ahead in 2021
MapAction and the Centre for Humanitarian Data are continuing to plan ways to collaborate throughout the rest of the year and beyond.
In addition to sharing expertise in advanced analytics, we are working to make data-driven methods accessible to wider audiences in the humanitarian sector in order to improve the effectiveness of aid programmes. MapAction and the Centre’s Data Literacy team have identified an opportunity to come together to develop GIS training material. This work aims to help non-technical humanitarians make better use of geospatial data to understand the needs of affected communities and coordinate aid.
Both teams are also collaborating to ensure that our data science workflows and models are published openly and can be used by others in the field. Inspired by initiatives such as The Turing Way, we are formalising and adopting best practices to write high quality code, document methodologies, and reproduce results.
At the end of the first year of our collaboration, it is gratifying to reflect on how much we have been able to achieve together while learning from each other and expanding our collective knowledge. We’re grateful to the German Federal Foreign Office for making this work possible by funding our Data Scientist role. We’re looking forward to continuing to work together to push forward the boundaries of humanitarian data science.
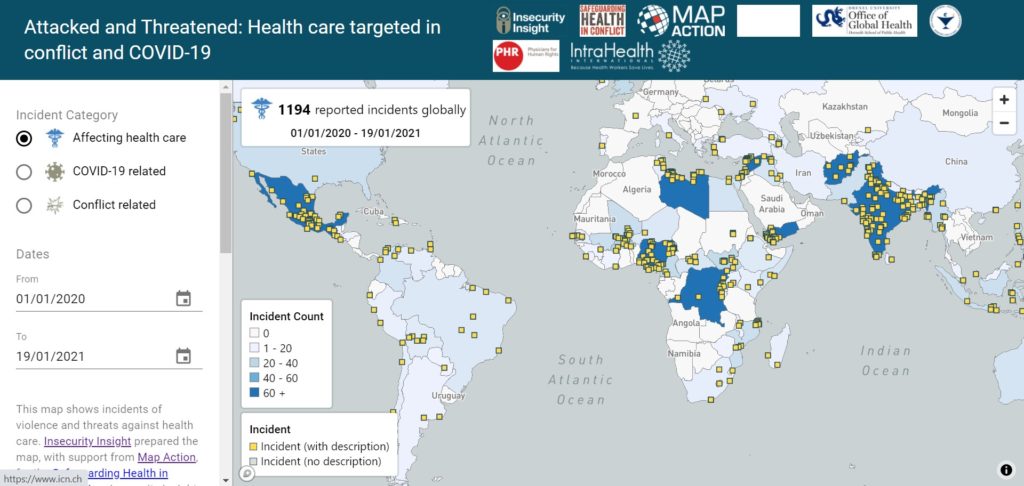
The increase in the number of security incidents affecting healthcare workers during the COVID-19 pandemic has been highlighted in an interactive web map launched today.
Incidents include the arson of COVID-19 testing facilities, the targeting of health workers on their way home from clinics, and violent responses to mask requirements.
Developed by Insecurity Insight, a non-profit which works to examine threats facing those living and working in dangerous environments, and MapAction, the user-friendly map is intended to support the aims of the Safeguarding Health In Conflict Coalition.
Christina Wille, Managing Director, Insecurity Insight, commented, “This tool gives stakeholders concerned with the protection of health care global insight into COVID-related incidents of threats and violence against health care providers to support better protection of health workers.”
The map depicts 412 acts of pandemic-related violence and threats to health workers and services around the world in 2020 out of a total of 1,172 incidents. Because not all incidents are reported or recorded, the actual number is likely to have been significantly higher.
To create the map, MapAction needed to consolidate the data available – which is often in indigestible formats and from multiple sources – understand the geographical context and visualise it. We brought our considerable experience in humanitarian mapping, information management, and solution design to the project, ensuring the information architecture is a stable platform that is easy to manage, while allowing for future adaptations and enhancements to be seamlessly integrated.
Christina continued, “We are working with MapAction to expand the map’s functionality and develop a similar tool for the education sector and other areas, as well as a map on security incidents affecting aid operations in Mozambique.”
In this video, MapAction volunteer Emerson Tan gives a report from the airport on his way home from Guatemala.
MapAction was mobilised to help the international response to the catastrophic impacts of Hurricanes Eta and Iota which have caused tremendous suffering across Central America, on top of the COVID pandemic.
MapAction is working in close collaboration with our partner CartONG to provide GIS & information management support to UNICEF – another long-term MapAction partner – on an as-needed basis around the world.
Working with UNICEF’s head quarters, country offices and partners in different parts of the globe, we are focusing on helping with geospatial data collection and management, mapping, knowledge management and capacity building.
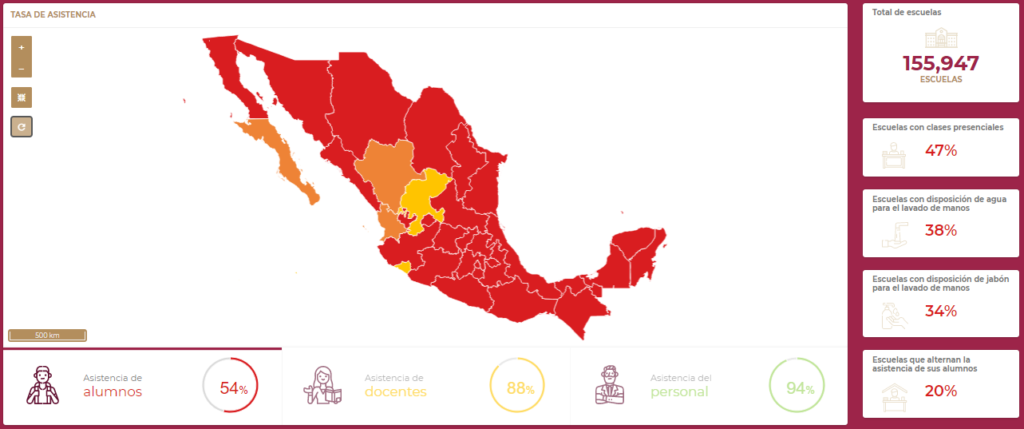
One of the projects we have been collectively working on is a data analysis dashboard to help educators in Mexico respond to the COVID-19 pandemic. This dashboard, which is updated on a daily basis, is a dynamic, interactive visualisation of information enabling education teams to monitor changes and identify trends in school attendance following COVID closures. It also provides general information on the state of schools’ water and sanitation infrastructure.
Screenshot of the dashboard showing sample data
The dashboard is currently in beta. When finalised, it is planned that all teachers across Mexico will have access to it to help them plan and respond to the evolving COVID crisis.
As well as helping CartONG to build the dashboard, MapAction has provided data processing scripts to ensure a seamless feed of data and has lead on the user testing and quality assurance aspects of the project.
For over a year, swarms of locusts have been ravaging large parts of rural Africa, affecting different countries at different times. Stripping the land of vegetation and destroying crops and food supplies, the highly destructive pest is causing additional severe food insecurity for communities already struggling to recover from drought and flooding, as well as coping with COVID-19.
Since April, MapAction has been working with Oxfam and its network of local civil society partners in Eastern and Southern Africa to help improve visibility of the work the partners are doing and improve communication flows between them, even during COVID lockdowns. This in turn is helping them to protect people’s food security, livelihoods and access to water, sanitation and hygiene (WASH) services as this complex and many-layered crisis evolves.
As well as mapping who is doing what and where to help, we have also been creating map templates and training people locally so that they can update and refresh the maps on an ongoing basis. This means that Oxfam’s partners can alert each other of threats such as locust swarms migrating into new areas.
In Somalia we have been assisting teams working on food security, livelihoods, WASH and protection by helping to triangulate information about locust infestations and areas affected by COVID. In Southern Africa, we have been helping Oxfam and its civil society partners set up and then maintain situational awareness of locusts and other threats to food security across the region.
One Oxfam project MapAction has been supporting involves mapping water ATMs – machines that allow water to be automatically dispensed when a customer places his or her token or card against an electronic reader, which regulates flow at a dispensing point. A chip within the token or card contains information about the amount of water the user has already paid for and water credits are deducted each time water is dispensed. The water ATMs are important points in areas such as informal settlements, ensuring access to safe, low-cost drinking water which is key in protecting people against water-borne diseases. Initially covering informal settlements around Nairobi, MapAction’s involvement has now extended to mapping ATMs in other areas.
Irene Gai, WASH strategist at Oxfam, said, “Sharing where work has been done is helping to avoid duplication of interventions, thereby saving resources that can be channelled to other needy areas. By having the maps shared with other WASH-sector agencies, they can target their own resources for similar initiatives in other places than where Oxfam has already supported.”
During the course of the work in East Africa, the MapAction team created our first automatically-generated maps, testing out this new approach which is part of our ambitious Moonshot programme. Among other things, this enables us to produce the best reference and baseline maps possible in almost no time at all, freeing up team time to focus on the specifics of the situation at hand.
Initially supporting Oxfam’s partners’ work in Kenya and Somalia, MapAction personnel are now also helping in Zimbabwe and Zambia, with scope to roll out to Malawi, Mozambique, Namibia, Angola, South Africa and Botswana. Additional projects in other countries may also take place.
Since March this year, a MapAction data scientist has been based at the Centre for Humanitarian Data in The Hague, supporting its workstream on predictive analytics. The aim of this important work is to forecast humanitarian emergencies and needs in order to trigger responses before a disaster occurs.
One of the projects the Centre’s predictive analytics team is working on, in partnership with the John Hopkins University Applied Physics Laboratory and individual country offices of the UN’s Office for the Coordination of Humanitarian Affairs (OCHA), is the development of COVID-19 modelling tailored for each country’s specific context. This seeks to predict the scale, severity and duration of the outbreak within each country, including its likely effects on particularly vulnerable groups, such as people at risk of hunger or those using solid fuel indoors for cooking.
The project is also modelling the effects of non-pharmaceutical interventions (NPIs) such as curfews, travel bans and face masks, according to what is locally viable.
The inclusion of country-specific factors, looking at projections for specific vulnerable groups as well as the general population at a sub national level, can make this work particularly helpful for governments and humanitarian organisations to inform their COVID planning.
Projected total infections per 100,000 inhabitants in Afghanistan on 2020-08-03. Projections are obtained by simulating local transmission in each district in Afghanistan and expected spatial and temporal spread between districts. Country-specific risk factors are included in the simulation at the subnational level.
The initial model was developed for Afghanistan and is now being extended to other priority countries including the Democratic Republic of the Congo, South Sudan and Sudan.
Earlier this year, MapAction was asked by the UN’s Office for the Coordination of Humanitarian Affairs (OCHA) to send a team to Turkey. Their mission was to provide assistance to humanitarian teams there and in Northwest Syria who are supporting the very large numbers of refugees and internally displaced people that arrived in the region during the first three months of the year following an upsurge of fighting in Aleppo.
Days before the MapAction team was due to travel, the UK and Turkey went into lockdown. Consequently, the team was compelled to switch rapidly to a remote-working approach.
Since late March, they have been helping the Clusters to get a better understanding of the locations and sizes of the camps and the needs of the people arriving and living in them. Camps vary enormously; from just a few tents to up to 93 separate sites within a single camp, and from long-term, static settlements to temporary ones.
As well as cross referencing, checking and cleaning data about camp locations received from numerous sources, the MapAction team developed some simple tools to help do this quickly and easily in future, which will also have benefits for other areas of work undertaken by the Clusters. One tool validates the location coordinates of camps recorded by teams within Syria, another matches them to Syrian administrative areas.
The MapAction team has also been locating aerial images of the camps on OpenStreetMap and using these to develop 900 map polygons showing the shape and size of each camp. As well as helping the Clusters to understand and meet the existing needs of people in the camps, this work will help to inform them about their population densities, which is particularly important in the context of COVID-19.
Updated to add: This project was shortlisted for a DataIQ Award for ‘Best use of data by a not-for-profit’.
The Voluntary and Community Sector Emergencies Partnership (VCS EP) is leading a collaborative initiative to establish a UK-wide coordination system for civil society organisations and charities participating in the country’s domestic response to COVID-19. It aims to provide support to people in vulnerable situations who aren’t able to get help locally. The initiative, which is backed by the UK government, is a huge undertaking and draws on expertise from a broad range of people and organisations.
The concept is based on a number of ‘tactical cells’ located around the four countries of the UK and made up of experts from across the voluntary and community sector.
These cells will oversee, coordinate and represent the voluntary and community sector’s response to Covid19. Each cell aims to identify the unmet need of people in the most vulnerable situations by linking information gathered from teams delivering front-line support to strategic decision makers. This rapidly changing information is used to ensure resources go to where they are most needed, for example by identifying where demand for support outweighs the local capacity available, or where needs are of a particularly specialist nature.
A four-person MapAction team has been supporting the VCS EP to set up, test and run the information flows and coordination systems for the tactical cells. Our input was solicited because of our team’s experience and knowledge of the challenges of creating and delivering a robust information management process across multiple countries in a complex and rapidly evolving crisis situation.
The VCS EP is co-chaired by the British Red Cross and the National Association for Voluntary and Community Action (NAVCA).
The new system is being rolled out this week and will be in place for the rest of the spring and summer.
MapAction volunteers have been supporting the World Health Organization (WHO) in Libya and Chad to process and map data about health and sanitation services, in order to support the response to COVID-19.
The volunteers have been working remotely, alongside each country’s health cluster (networks of WHO partners that work together to relieve suffering and save lives in humanitarian emergencies). They have been helping to identify and map what healthcare, water and sanitation services and aid are being provided, by whom, when and where. This is known as 4W mapping and is important to help identify gaps and avoid duplication.
We are now looking at providing similar assistance to WHO in other parts of North and Central Africa.
At a time when charities throughout the UK and around the world are being severely impacted by big drops in fundraising income caused by the Corona virus, MapAction is busier than ever before.
We’re helping national governments, the UN and humanitarian organisations across the globe make rapid sense of the COVID-19 pandemic and plan the best response, to save the most lives and minimise the long-term impacts.
Managing a pandemic of this kind requires the rapid collection and analysis of vast amounts of data. Without maps and data, those responding to the crisis are effectively blindfolded. This is where MapAction’s help is crucial. Our expertise in humanitarian information management and mapping is hugely in demand, as we face a global crisis of unprecedented scale. We’re having an impact, right at the heart of the world’s response.
At the same time, other humanitarian emergencies that existed pre-Corona, or have occurred since its onset – such as Cyclone Harold and the Syrian refugee crisis – require our urgent assistance too.
Like all charities, our funding has been affected by the COVID crisis. That’s why we’re asking all our supporters to take part in the MapAction 2.6 Challenge.
Here’s what you need to do:
Plan a 2.6-mile route around your home using a tool like mapmywalk.com or the map app on your phone. Make sure you adhere to government guidance and social distancing measures in force where you are.
Run, walk, cycle, scoot, hop, jump or anything-you-like around your route between 26 April and 1 May 2020. You could even do the same loop ten times to make it 26 miles!
If you can’t leave your home, you can still take part by performing any activity you like 26 times (do 26 sit ups or 26 minutes of yoga, toss a pancake 26 times…). If you like, you can create a fantasy 2.6 mile map route that you plan to do one day.
Take a picture of you doing your challenge (videos and GIFs are also v welcome, but make sure you include at least one photo), and a screenshot of your route map, if applicable. Send them to fundraising@mapaction.org with your name(s). (Route maps will be anonymised before we share them. By sending us your name and images, you consent to us storing and publishing them.)
Share your picture/video/GIF on social media with the hashtags #MapAction26Challenge and #twopointsixchallenge. (NB don’t share a map that shows where you live.)
As well as the money you donate, we will receive a portion of a central fund being collected from large corporate donors. The amount of that we receive will be proportionate to the amount of donations we receive, so please give as much as you can.
MapAction’s partner Médecins Sans Frontières (MSF) provides rapid-response medical teams to assist in conflict zones, natural disasters and epidemics. On any given day, its staff treats tens of thousands of patients for a variety of illnesses in its medical programmes around the world.
MSF is very concerned how the COVID-19 pandemic will affect people in countries with already fragile health systems. In many areas where its teams work, there are few medical organisations in a position to respond to an overload of patients.
In order to provide the best medical aid as fast as possible, MSF is working with its technical partner CartONG to create a single repository for all the information its operations personnel need to rapidly respond to the COVID crisis, including information about travel restrictions, flights, cargo transport, availability of supplies, etc. A MapAction team member has been seconded to this technical task force in the role of GIS coordinator. As well as bringing technical expertise in data and content strategy, he’s helping to define and prioritise the information needs of MSF teams and create content for the new platform.
MapAction has been helping its partners the World Food Program (WFP) and Caribbean Disaster Emergency Management Agency (CDEMA) to distribute mobile app questionnaires about availability of and access to food during the COVID-19 pandemic.
Over the past several years, we have been working with CDEMA and other organisations to build a network of GIS professionals in the Caribbean region (and elsewhere) with a shared interest in disaster preparedness and information management. We were able to use this network to help disseminate the questionnaire as widely as possible across the region in order to gather information about potential food shortages once incidences of the virus escalate.
A MapAction team member currently based in New Zealand is providing GIS, mapping and information management support to the UN Office for Coordination of Humanitarian Affairs (OCHA) in Asia and the Pacific (ROAP).
Over the next two months, he will be helping ROAP to support countries that have limited public health infrastructure and resources to cope with the rapid onset of COVID-19. He will be assisted in this work by MapAction’s team of volunteers.
ROAP covers 41 countries in Asia and the Pacific and currently supports these countries in their efforts to ramp up preparedness and response through the UN Resident Coordinators and their offices, as well as local governments.
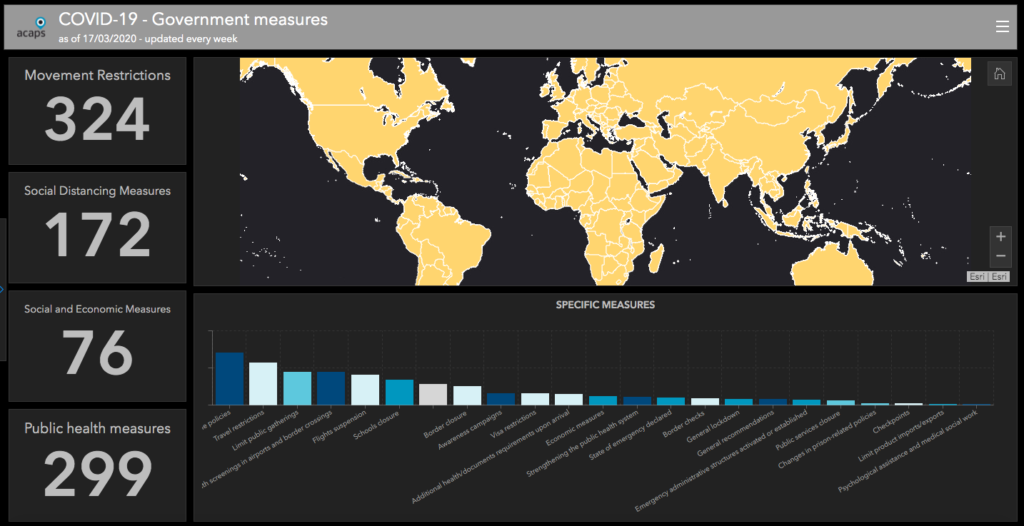
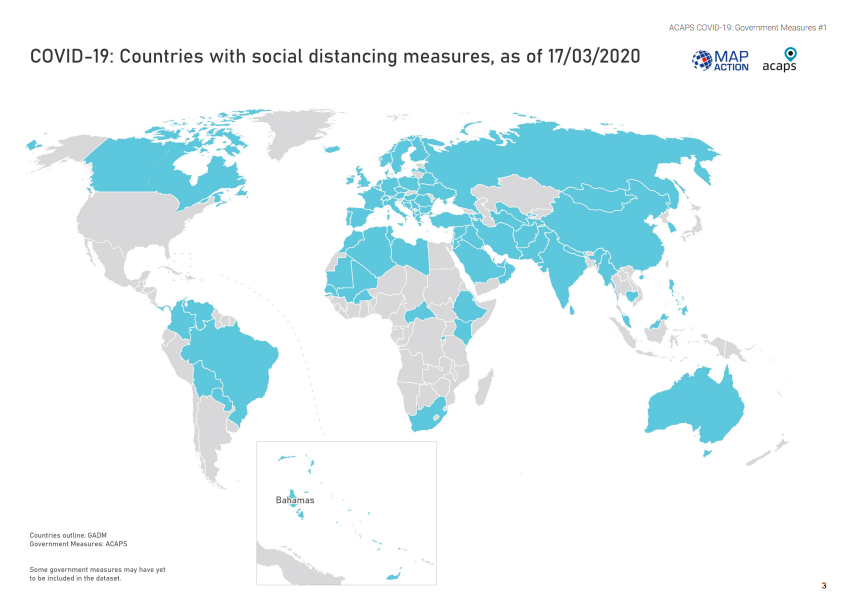
We’ve helped ACAPS to put together a dashboard showing government measures being taken around the world. Data can be filtered by region, country, type of measure and timeframe.
We will be updating this twice a week. In the meantime ACAPS, MapAction and other organisations are looking at further topics to develop analysis for.
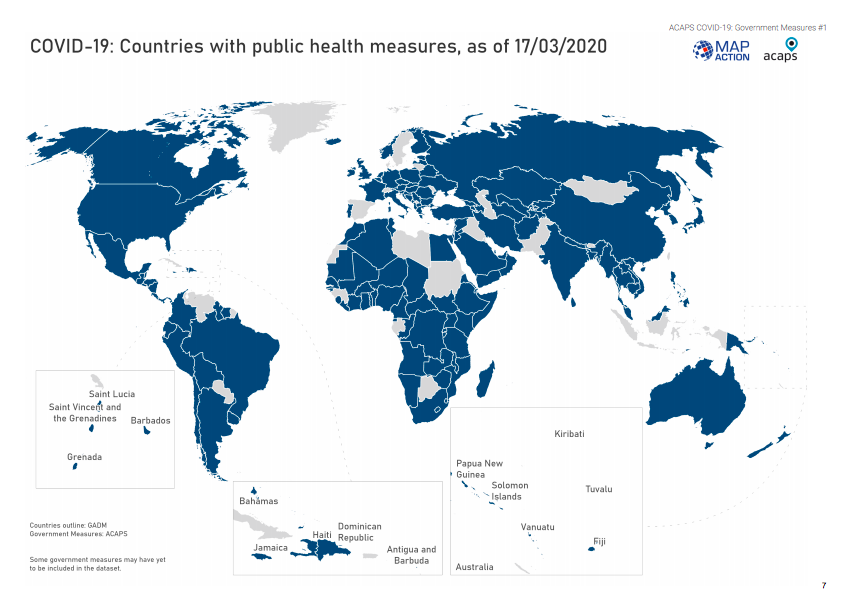
The first bulletin in a series about measures adopted by governments in response to COVID-19, as well as potential impacts on ongoing humanitarian operations, has now been published by ACAPS.
MapAction is collaborating with ACAPS and other partners to provide analysis, maps and visualisations of the pandemic as it evolves to assist governments and aid agencies in their response.
Since last week, we have been working with our partner ACAPS, the independent humanitarian analysis organisation, to support their efforts looking at the longer term humanitarian effects of COVID-19.
Every Wednesday, starting today, ACAPS will be publishing a weekly bulletin about government measures around the world in relation to the virus. MapAction is assisting this work with analysis, mapping and visualisations of the collected data. The data is also being published via the Humanitarian Data Exchange (HDX).
This information will enable teams planning the response to the pandemic around the world to see what steps are being taken in different countries and what the impacts of those measures are.