Ode to a geospatial humanitarian partnership and shared values

From Mexico to South Sudan, Malawi and worldwide, MapAction and CartONG have worked together for nearly a decade to bring geospatial solutions to the humanitarian aid and international development sector. Our underlying core shared values help us support NGOs and aid actors for more impactful assistance.

Image: CartONG.

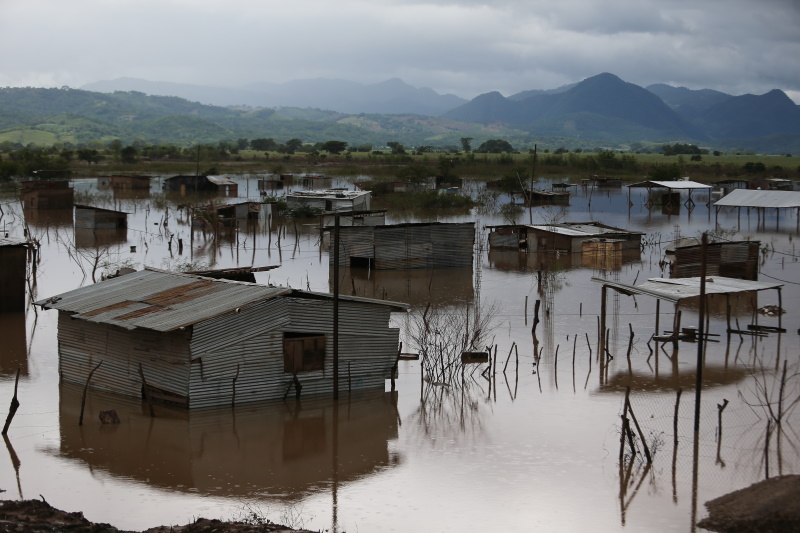
What happens if information barriers aren’t broken down for humanitarian agencies in emergencies? Food gets sent to the wrong people, search and rescue teams are misinformed, temporary settlements are set up in misguided places. Lives are lost or ruined because the right data was missing.

Breaking down information barriers

At MapAction and CartONG we embrace and live by the same values embedded in a single idea: the application of geospatial technology to improve the quality and impact of humanitarian assistance and development projects. Every map, mapathon, training event, data analysis tool or geospatial element of disaster preparedness we co-strive to create can be the key to getting aid to a stricken community or to understanding and preparing for the worst effects of a drought, flood or health emergency. These shared core values and resources have led to a beautiful cross-channel partnership between UK-based MapAction and France-based CartONG. A partnership that aims to improve the impact of aid actions by providing decision-makers and vulnerable communities with the right data to understand and mitigate any crisis.

Decade-long partnership

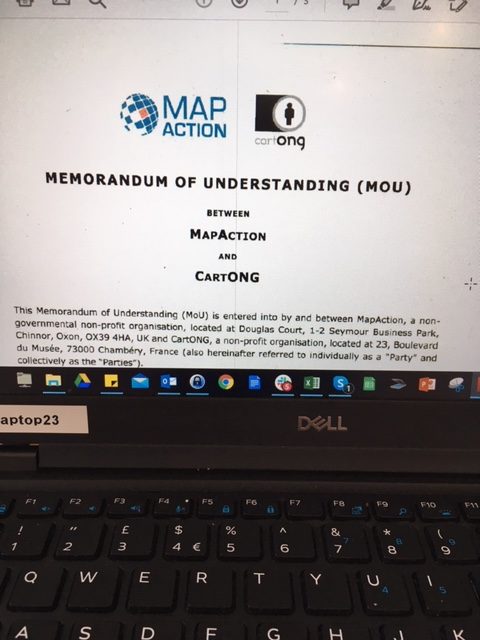
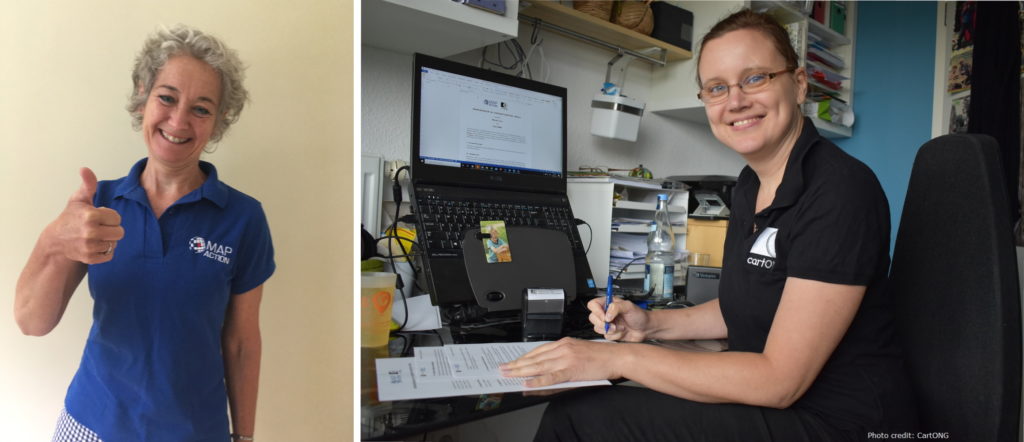
Our partnership has already lasted nearly a decade. As part of the Covid-19 response, MapAction seconded staff to help CartONG with the surge of activities in its partnership with Medecins Sans Frontieres (MSF). Having already worked together for several years on various projects, including as part of the H2H Network, a peer-to-peer humanitarian network, MapAction and CartONG signed a Memorandum of Understanding (MoU) to work more closely together in 2020.

READ ALSO: MapAction strengthens partnership with CartONG

READ MORE: CartONG strengthens collaboration with MapAction via the signing of a MoU

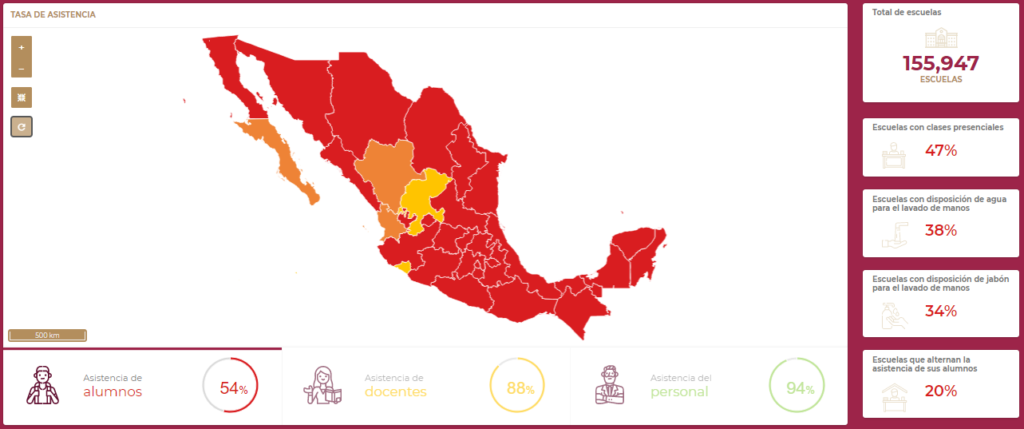
CartONG and MapAction have since worked together on a number of different projects. In Mexico, together with UNICEF and the Mexican government, MapAction and CartONG supported the creation of a dashboard aiming to display and monitor real-time information on key education indicators on elementary schools at the national level in order to map COVID-19 affectations before the start of the new school year in 2020. It was created to display and monitor real-time information on key education indicators for all elementary schools. This relied on over 200,000 individual schools uploading their data on a daily basis, and was the first time that this information would be collected and displayed at a national level.

Screenshot from a dashboard on the Mexico project. Image: Screenshot/UNICEF.

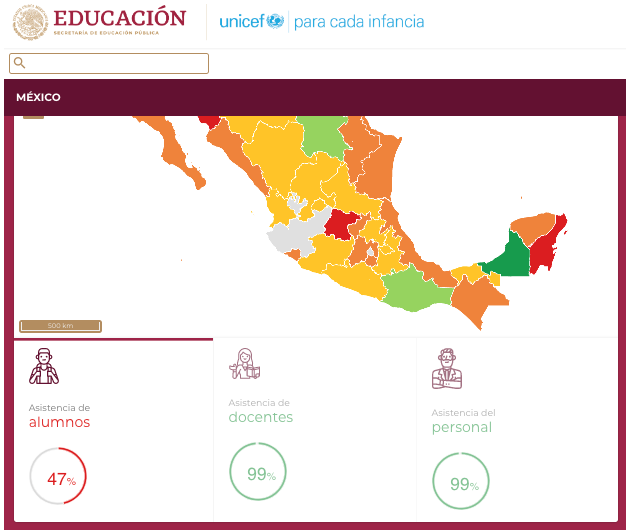
READ ALSO: Developing an analytic dashboard for back to school follow-up in Mexico with MapAction

READ MORE: Post-COVID Progress: Helping Mexican schools reopen

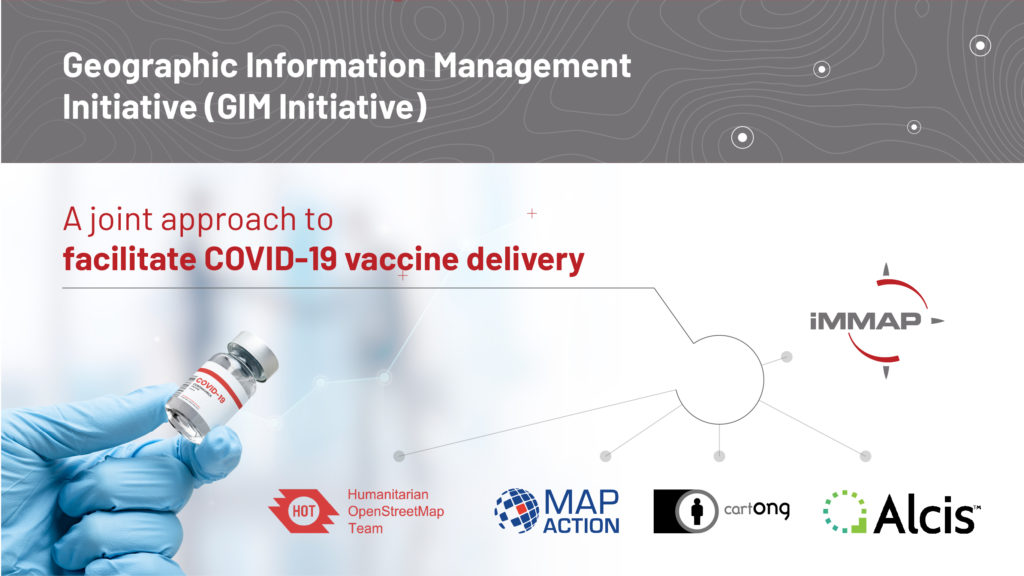
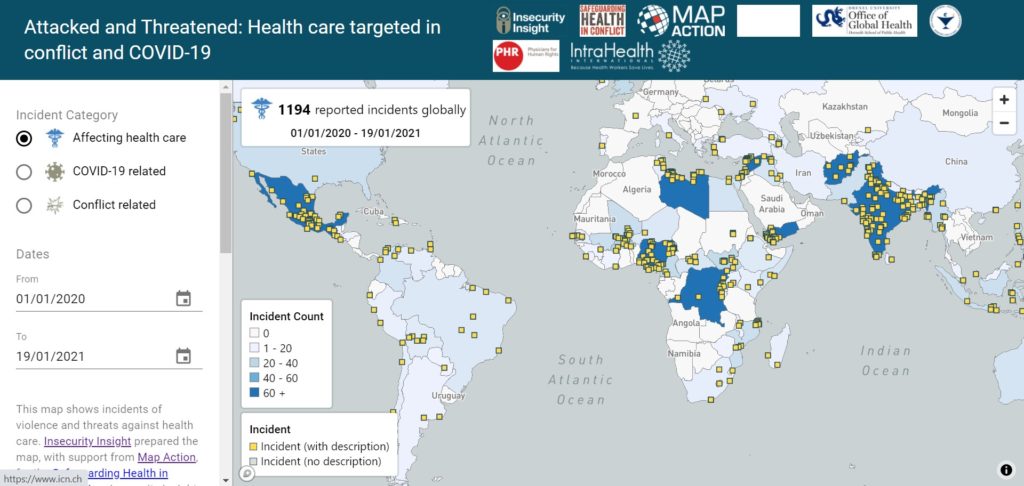
In South Sudan, MapAction and CartONG, together with other partners, worked to  identify the data challenges that might slow down ‘final mile’ vaccine delivery in a challenging data environment. One outcome of this work was the Integrated Humanitarian Data Package, that aimed to give quick and easy access to key geographic data that underpins the planning and delivery of vaccination programmes. This pilot health project highlighted the vital role that geospatial technology can play in creating effective healthcare solutions. High quality mapping and data analysis is key to understanding how many people need vaccinating, where they are, and how and where the vaccines can be safely stored and delivered.

READ ALSO: South Sudan data package to support effective and equitable Covid vaccine delivery

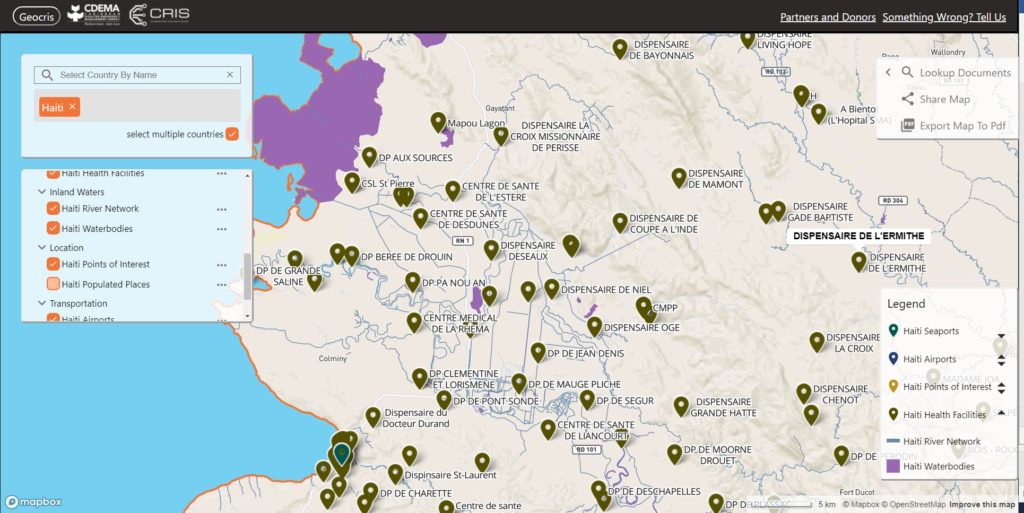
In 2023, CartONG and MapAction again used the IHDP to map the outbreak of cholera in Malawi. We are also both partners on the ‘UNICEF Geospatial Hotline’, where interested UN departments can request specific geospatial services from our organisations.

As we look ahead, we know the crises we try to mitigate will become evermore complex and challenging; the funding landscape evermore volatile. That is why our partnership continues to grow and why the alliances we are building with organisations like H2H, UNICEF and Start Network are so vital. We will soon also be announcing a new and exciting joint-project linked to health in West Africa. More on that soon.

We both remain committed to continue to deliver capacity building events and projects worldwide to strengthen disaster preparedness and improve the impact of humanitarian assistance.

Souhaitez-vous lire cet article en français ? Cliquez ici!

MapAction signs WHO partnership agreement underlining growing support for health emergencies

Image by Gerd Altmann from Pixabay

MapAction has signed the Standby Partnership Agreement with the World Health Organisation (WHO) which will allow the UK-based emergency response and disaster preparedness charity to have greater impact in health emergencies. 

The agreement will see MapAction volunteers ready on standby to deploy to any health emergency operations at the request of the WHO. This will help bring the organisation’s unique data-driven approach to saving lives in even more health crises worldwide. 

The Standby Partnership Agreement will streamline and simplify how MapAction can deploy to WHO emergency operations at short notice. The agreement states that MapAction will “maintain a roster of standby personnel….for the rapid mobilisation and deployment of pre-screened individuals…to WHO emergency operations.” 

“We will provide some surge support that will be relevant to WHO emergency operations,” MapAction’s CEO Liz Hughes says of the agreement, noting that it is an important step to being able to deploy faster and more efficiently alongside WHO teams in emergency operations. “We have a growing knowledge of health needs through our own work” adds MapAction’s CEO. 

MapAction has already lent data management, geospatial and mapping support in 13 health-related emergency deployments worldwide since 2014. Teams of volunteers from the Oxfordshire-based charity were involved in providing support in the Ebola crisis in West Africa, as well as during the more recent COVID-19 pandemic. A team of MapAction volunteers is also currently working on a project to reduce the impacts of cholera in Malawi. 

MapAction personnel have also contributed to a leading sector title on how to respond to health emergencies (In Control: A Practical Handbook for Professionals Working in Health Emergencies Internationally).  

Besides deployments to emergency health crises, MapAction has also developed, with partners, the Integrated Humanitarian Data Package (IHDP) tool, designed to aid final mile vaccine delivery planning and logistics. It contains selected data sets, information explaining the data (‘metadata’) as well as GIS and coding tools which allow users to easily develop situation-specific items such as maps and other graphics. 

The IHDP was trialled during the roll out of COVID-19 vaccines in South Sudan.

It was adapted in Burundi in late 2022 to combat the impacts of malaria. 

Deepening the impact and effectiveness of humanitarian information

MapAction has begun an important and exciting programme of work funded by the U.S. Agency for International Development’s Bureau for Humanitarian Assistance (USAID BHA)USAID logo

The new grant, aimed at strengthening the sector, runs from 2021-2024. It will see MapAction working with local, regional and international organisations to ensure that Geographic Information Systems (GIS) and information management processes are at the heart of humanitarian operations, including preparedness, anticipatory action and emergency response activities. 

This work builds on the achievements of a previous BHA-funded programme that took place from 2017-2021, which helped improve the use of GIS and spatial analysis across the humanitarian response sector through preparedness work and training with key partners.

Specifically, the new fund will help us to address the key data and information management gaps at regional and national levels, as well as working with Civil Society Organisations (CSOs) and urban authorities at the local level. This will enable us to build on localisation initiatives and establish context-appropriate surge capacity.

It will also allow us to continue our work to develop best practice for managing information in humanitarian contexts and enhancing the policy environment. 

It will be implemented by MapAction’s team of experienced and highly skilled staff and volunteers who will work closely with partner organisations to build on the relationships and foundations we have already established and develop new relationships with regional and national partners.

Our experience, skills and expertise, including in data science, means that we are uniquely placed to build on and share what works well in humanitarian information management, combined with the latest thinking in key areas related to data quality and preparedness.

By applying the best geospatial technologies to humanitarian problems, partner organisations can gain critical insights, enabling them to multiply their effectiveness.

Ultimately, this fund will mean that decision makers are better informed so they can more effectively anticipate, prepare for and respond to emergencies.

Training Caribbean disaster managers

We are proud to be supporting the delivery of an online course in crisis mapping in the Caribbean this month. The training course will involve around 50 disaster management professionals from across the Caribbean and is in partnership with the Caribbean Disaster Emergency Management Agency (CDEMA), with input from the Humanitarian OpenStreetMap Team (HOT). 

This is the second time the online course has been run, and we used our extensive deployment and training experience in the design and development of it.

Screenshot of GeoCRIS
Screenshot of the GeoCRIS showing a map of part of Western Haiti with several map layers selected

As well as learning the principles of disaster mapping for response and resilience and OpenStreetMap data entry, the participants are practicing effective use of the GeoCRIS. This is the new regional repository for geospatial data needed for risk and hazard mapping, disaster preparedness and response operations. As MapAction was involved in setting up the GeoCRIS, we are well placed to design and deliver this training.

The month-long course also includes a disaster simulation exercise in which the students will have the opportunity to deploy their newly acquired skills in a realistic emergency scenario. Additionally, two members of MapAction’s Caribbean volunteer team who have both recently been involved in the response to the La Soufrière volcanic eruption will be running a live session to share their real-world experiences of emergency mapping in the region and answer questions.

We’re grateful to USAID’s Bureau for Humanitarian Assistance (BHA) for funding this activity as part of our ongoing programme to improve the ways in which geographical information systems (GIS), mapping and spatial analysis are used in humanitarian emergencies.

Strengthening urban resilience with GNDR

MapAction’s strategy to 2023 aims to use geospatial technology and insight to bridge the gap between humanitarian need and available resources. We are doing this by, among other things, helping local, regional and global civil society networks to conduct their own geospatial analysis, and bolstering the resilience of urban communities to different types of crises.

aerial view of city landscape with many high-rise buildings

As part of our programme of work funded by USAID’s Bureau for Humanitarian Assistance (BHA), we are currently working with the Global Network of Civil Society Organisations for Disaster Reduction (GNDR) towards these two strategic objectives. GNDR is also midway through a BHA-funded programme entitled ‘Making Displacement Safer’ and we have aligned our targets in order to collaborate around our shared goals.

In the first phase of our collaboration with GNDR, MapAction intern Kelly Rutkowski targeted practical application of her research project within her Master of Science in Disasters, Adaptation, and Development to create a system framework for examining urban preparedness. She also mapped two case studies for GNDR in Khulna, Bangladesh and Garut, Indonesia.

We are now in the second phase of our collaboration, in which we are providing advice and support to GNDR’s civil society partners in Sri Lanka, Indonesia, Nepal and Niger for geographical analysis and mapping. The learning gained both supports GNDR’s programmes in urban areas and increases MapAction’s knowledge of how we further our own urban and civil society programmes.

Responding to the Volcanic Eruption in St Vincent and the Grenadines

By Lavern Ryan, MapAction volunteer.

Selfie of Lavern Ryan outdoors with sea visible in the distance behind her

“Alert Check: Volcanic Eruption St Vincent and the Grenadines, please sign up your availability.” Those were the words which greeted me as I checked my MapAction email. Simple words, but so profound for me. They really hit hard, and hit home! I could not ignore that call for action. I signed up for remote deployment. It turned out to be my first official response deployment as a MapActioner!

Like many people within the region, I have been observing the volcanic dome growth in St Vincent and the Grenadines since late 2020. As it grew, magma continued to fill the space around the old 1979 dome, as depicted in the images below.

aerial photo with annotation showing growth of magma dome on 11 dates between 27 Dec 2020 and 12 Feb 2021
Source: Scientific Resource Centre
aerial photo of La Soufriere volcano showing dome on 6 Jan 2021
Photo credit: NEMO, St. Vincent and the Grenadines
aerial photo of greatly enlarged magma dome with gases escaping
Photo credit: NEMO, St. Vincent and the Grenadines

A period of elevated volcano-tectonic (VT) earthquakes, which began on 23rd March, 2021, indicated to scientists that the situation at La Soufrière had deteriorated. An evacuation order was issued on April 8, 2021 by Prime Minister Ralph Gonsalves.

The very next day, on April 9, 2021, La Soufrière Volcano erupted! The eruption was very visible to people around the world due to the prominence of posts on social media. It was easy to see live feeds and video posts as the action unfolded. Images of the massive mushroom plume created by the eruption brought back so many memories for me. It was beautifully dangerous!

photo of very large and impressive gas plume

Having experienced the eruption of our very own Soufrière Hills Volcano in Montserrat and having lived with an active volcano for the past two decades, I empathised with the residents of St Vincent and the Grenadines. Being displaced from one’s home to live in a shelter is no easy feat. Having to leave behind the beloved island you call home is even more challenging. I knew the road ahead for many people would be long and difficult. Hence my conviction to help in the best way I knew: – by providing geospatial support.

It was great news to discover that Mike was also selected as a member of this remote deployment team for the St. Vincent Response. Mike and I were recruited at the same time in 2019 to form part of the Caribbean Section of MapAction. The picture below is a throw-back to June 2019 in Trinidad. We had several days of intense conversion training sessions. In retrospect, those days really set the foundation for our ability to deliver during this response.

Our team was led by Matt who resides in New Zealand. He is very knowledgeable and has significant experience in deployments. We also received additional support from another volunteer, Pip, who is located in the UK. We supported the Caribbean Disaster Emergency Management Agency (CDEMA) for a period of three weeks. Subsequently, another two volunteers, Ant and Jorge, were deployed to support the environmental work of the United Nations Environment Programme’s (UNEP) response. We represented different time zones and locations from across the globe.

map of the world showing locations of team members working for CDEMA and  United Nations Environment Programme and the La Soufriere volcano

This unique team selection, worked out very well, as it offered 24 hour coverage for the St. Vincent response. Mike and I, being located in the Caribbean region, were uniquely placed to attend briefing meetings in our local time zone and follow up with any new developments; while Matt provided another level of support from New Zealand, as his day began when ours was coming to an end. No sleep lost – I guess! Our daily briefing meetings allowed us to report our findings during that day and to strategise the allocation and completion of tasks.

MapAction has mastered the ability to use different tools to share and work together in a remote working environment. In my opinion, the COVID-19 pandemic has only strengthened this area. The image below highlights some of the main tools we used to ensure smooth deployment coordination.

logos, names and applications of different tech tools:
Jira - task management
Slack - internal comms
Google File Stream - file storage and sharing (streaming)
Gmail - external comms and sitreps
Confluence - rolling documentation specific to the response and SOPs (standard operating procedures)

One of the major needs of any emergency response is geospatial data. The ‘data scramble‘ as the term is coined, involves the researching, collating and organising of all the spatial data available for a particular location, ensuring that it is fit for purpose. The data collected was prepared by transforming it into the correct projected coordinate system to allow for overlay and integration between different datasets. Datasets included administrative boundaries, such as parishes, census districts, shelter locations, elevation data, transportation networks, buildings, land use, hazard zones, and health centres, just to name a few. These were placed in appropriately themed folder locations so that it would be easy for deployed members to find them during the response.

Coordinating with CDEMA, MapAction provided mapping support to to aid in visualisation of the situation on the ground.

One of the first maps prepared is a reference map of the area. I consider this to be one of the most important maps to be prepared, as it gives context to the area of interest. Everything else is built upon this.

The basemap shown on the left below is detailed with settlement locations, roads, parishes, village names, rivers and elevation data. The baseline map sown on the right, highlights the population figures of St.Vincent derived from the most recent 2012 census survey. This allowed us to understand how the population is distributed throughout the affected areas.

To provide further understanding, situational maps were prepared. Data being shared through situation reports from the Emergency Management Agency allowed us to create visual representations of what was happening on the ground. The map on the left, shows movement of displaced people from affected communities in the red, orange and yellow zones. The map on the right shows the location and status of the shelters.

Additionally, a 3D webmap was created showing the key volcanic events and hazards of the La Soufrière volcano. This dynamic map allows you to explore the data which was used to create the maps above and offers a better understanding of the risk posed by the volcanic eruption in St. Vincent.

3D webmap showing volcanic hazards

Working so closely with the data from St. Vincent during this period of time, allowed me to become very familiar with areas and village locations on the island. Seeing feeds on social media allowed me to identify quickly with where things were happening. Names such as as Chateaubelair, Troumaca, Byera, Owia and Fancy stood out to me!

During my remote deployment, some acronyms were mentioned frequently during our briefing meetings. I eventually got the hang of them! These all form part of the response mechanism which helps the crisis on the ground to be addressed. Each of the teams highlighted below, played a very important function in being able to get supplies into St. Vincent, assessing the needs of the population and understanding the impact of the disaster on the island.

Table of humanitarian acronyms and their meanings:
ACRONYM	DESCRIPTION
CDRU	CARICOM Disaster Relief Unit
COST	CARICOM Operations Support Team
DART	Disaster Assessment Response Team
RCC	Regional Coordination Centre
RNAT	Rapid Needs Assessment Team
SRC	Seismic Research Centre
UNDAC	United Nations Disaster Assessment and Coordination

A number of other international organisations responded to the crisis in St Vincent and the Grenadines by activating their disaster response mechanisms and programmes. The links below provide additional insight into their response activities.

  1. Copernicus Emergency Management Service
  2. The International Charter Space and Major Disasters
  3. Maxar: Open Data Program
  4. Nasa Disaster Program

Satellite images like the ones below were captured as time progressed and further mapping and analysis was carried out. Derived information proved useful to responders on the ground.

satellite image of the Owia Bay area
satellite image of the Rabacca Bridge and Chatoya National Park

MapAction is known to respond in-person during an emergency response deployment. Although the COVID-19 pandemic has limited this, my experience through this remote response deployment has shown that MapAction’s involvement is still significant in providing geospatial information to support the humanitarian needs of people in crisis. I do look forward to future deployments with MapAction!

Lavern in the back of a truck driving through a rural tropical location, wearing a MapAction teeshirt with a large logo on her back.

This article was first published on Lavern’s own blog on 24 May 2021.

MapAction and HeiGIT partner to further geoinformation innovation

The Heidelberg Institute for Geoinformation Technology (HeiGIT) and MapAction have signed a Memorandum of Understanding (MoU) outlining their plans to collaborate in a number of areas.

Both organisations share a common vision to support humanitarian mapping by providing innovative geoinformation services for humanitarian response, mitigating risk, anticipatory action and economic development. This includes developing up-to-date disaster maps based on OpenStreetMap (OSM).

In order to fulfil these objectives, HeiGIT and MapAction will work together on various activities involving research and development, teaching, outreach and fundraising.

Examples of current and emerging services we plan to jointly develop include OSM analytics such as Humanitarian OSM Stats, which provides detailed statistics about humanitarian mapping activities in OSM, as well as OSM data-quality assessment and improvement. Here, the ohsome quality analyst is of particular interest, which provides end users such as humanitarian organisations with information on the quality of OSM data for a specific region and use-case.

Further tools may include apps for crowdsourcing, data collection, navigation, routing and logistics services and machine-learning-based methods for data processing and enrichment.

We will also share knowledge, with MapAction contributing experiences aligned to HeiGIT’s teaching curriculum, and HeiGIT, in return providing teaching materials and research results to MapAction.

MapAction partners to support COVID-19 vaccine delivery

Administering billions of shots of COVID-19 vaccine around the world is a logistical challenge of unprecedented proportions. It is even more complex in countries lacking basic healthcare infrastructure, cold storage or comprehensive transport networks, or where accurate population information is not available.

Understanding how geospatial analysis can help, MapAction is partnering with other geographic information specialists to help coordinate the delivery of COVID-19 vaccines in 15 low-income countries with acute humanitarian needs. 

The Geographic Information Management Initiative for COVID-19 Vaccine Delivery (GIM Initiative), which launches today, aims to help local partners tackle critical issues such as the selection of distribution sites, the planning of healthcare workers’ journeys to remote locations when no up-to-date maps exist, how to record doses and follow up with vaccinated people, and challenges around accessing the most vulnerable communities, including settlements that aren’t yet mapped. 

MapAction is joined in the GIM Initiative by Alcis, CartONG, Humanitarian OpenStreetMap and iMMAP.

A year of collaboration with the Centre for Humanitarian Data

Headshot of Hannah Ker outdoors

By Hannah Ker, Data Scientist at MapAction

In March 2020, MapAction and the UN OCHA (Office for the Coordination of Humanitarian Affairs) Centre for Humanitarian Data embarked on a new level of collaboration by sharing a Data Scientist’s time between the two organisations. Both teams had a lot to offer and learn from each other, with MapAction bringing its geospatial expertise to the Centre’s Predictive Analytics (PA) team. Predictive analytics is a form of data science that uses current and historical facts to predict future events. For MapAction, this collaboration also constituted an important aspect of our Moonshot, which sees us transitioning from being a passive data consumer to an organisation that actively contributes to humanitarian datasets.

2020 Highlights

Looking back on our work over the past year, we can see how this collaboration has benefitted both organisations in many ways, with numerous positive repercussions more widely. Ultimately, the fruits of our joint working are examples of how data science can help to reduce suffering and save lives in humanitarian initiatives. 

Your input leap-frogged us forward. It is amazing to me how quickly we were able to do this together. A round of applause for your work and its contribution to unlocking critically needed aid for Ethiopians.

Josée Poirier, Predictive Analytics Technical Specialist, Centre for Humanitarian Data

Preventing hunger

In the latter part of the year, a MapAction team of volunteers helped the Centre’s PA team develop analysis for a drought-related anticipatory action framework which was designed to trigger mitigation activities ahead of a predicted drought crisis. The PA team aimed to better understand the reliability of various indicators used to predict potential food shortages caused by drought in Somalia and Ethiopia. These indicators were then used to trigger an early release of funds from the UN’s Central Emergency Response Fund (CERF). The MapAction team reviewed past literature, evaluated available satellite images, and created a prototype drought model in Google Earth Engine (a platform for visualising and analysing satellite imagery of Earth). These inputs helped the PA team to flag an upcoming crisis in Ethiopia and trigger an activation for a humanitarian response. In the words of Josée Poirier, Predictive Analytics Technical Specialist from the PA team: “Your input leap-frogged us forward. It is amazing to me how quickly we were able to do this together. A round of applause for your work and its contribution to unlocking critically needed aid for Ethiopians.”

Flood mapping

The MapAction and PA teams also collaborated to implement and validate an approach for mapping flooding from satellite imagery. MapAction’s Data Scientist has been working with the PA team to help evaluate the impact of recent anticipatory action in Bangladesh which took place in July 2020 and was the fastest-ever allocation of CERF funds. To better understand how this aid was helpful to those affected, the PA team needs to know exactly when, where, and for how long flooding occurred. Contributing to this work also has direct benefits for MapAction’s own work, enabling us to add a new data processing method to our disaster-response toolbox. We then had the opportunity to test this methodology in our response to the devastating impacts of Hurricanes Eta and Iota in Central America. 

MapAction was able to test the flood-mapping methodology developed with the Centre for Humanitarian Data in the response to Hurricanes Eta and Iota in Central America. Photo: European Union, 2020 (D Membreño)

COVID-19

Both organisations have made commitments to assist in the global pandemic response. The Centre PA team and MapAction Data Scientist have, in partnership with the Johns Hopkins University Applied Physics Laboratory (APL), developed a model to forecast the number of cases, hospitalisations, and deaths due to COVID-19 for six countries, tailored to each country’s specific humanitarian needs. Named OCHA-Bucky, the model offers sub-national projections, and takes into the account the effects of non-pharmaceutical interventions. Presently, MapAction is participating in a pilot project to aid vaccine rollout in vulnerable countries by surveying the current data landscapes and identify gaps in order to address the logistical challenges inherent in such tasks. Along a similar line of work, the Centre PA team and APL are planning on adding vaccination strategies to the OCHA-Bucky model. 

animation of new COVID infections model in Afghanistan
Projected total infections per 100,000 inhabitants in Afghanistan on 2020-08-03. Projections were obtained by simulating local transmission in each district in Afghanistan and expected spatial and temporal spread between districts. Country-specific risk factors were included in the simulation at the subnational level.

Shared goals

There is substantial overlap between the broad technical goals of the two organisations. The Centre’s Humanitarian Data Exchange (HDX) contains over 18,000 datasets and it has created several automatic pipelines (software that carries out a series of data-processing steps) to systematically ingest data from its partners into its database. The Centre’s technical expertise has so far been a key input into the planning and development of a similar (albeit smaller scale) pipeline at MapAction, which is being created to automate the generation of core maps as part of the Moonshot initiative. This work will ensure that base maps essential for coordinating any type of humanitarian response are immediately available whenever they are needed. 

The two organisations share similar data access platforms and are actively engaged in ongoing discussions regarding different ways to construct pipeline software. Finally, both HDX and MapAction ultimately seek to identify and rectify gaps in the humanitarian data landscape in order to ensure that those coordinating the preparations for and responses to different types of emergencies have the reliable, timely information they need. 

Looking ahead in 2021

MapAction and the Centre for Humanitarian Data are continuing to plan ways to collaborate throughout the rest of the year and beyond. 

In addition to sharing expertise in advanced analytics, we are working to make data-driven methods accessible to wider audiences in the humanitarian sector in order to improve the effectiveness of aid programmes. MapAction and the Centre’s Data Literacy team have identified an opportunity to come together to develop GIS training material. This work aims to help non-technical humanitarians make better use of geospatial data to understand the needs of affected communities and coordinate aid. 

Both teams are also collaborating to ensure that our data science workflows and models are published openly and can be used by others in the field. Inspired by initiatives such as The Turing Way, we are formalising and adopting best practices to write high quality code, document methodologies, and reproduce results. 

German Humanitarian Assistance logo

At the end of the first year of our collaboration, it is gratifying to reflect on how much we have been able to achieve together while learning from each other and expanding our collective knowledge. We’re grateful to the German Federal Foreign Office for making this work possible by funding our Data Scientist role. We’re looking forward to continuing to work together to push forward the boundaries of humanitarian data science.

Interactive map shows violence and threats to health workers during COVID-19

Screen shot of interactive web map

The increase in the number of security incidents affecting healthcare workers during the COVID-19 pandemic has been highlighted in an interactive web map launched today.

Incidents include the arson of COVID-19 testing facilities, the targeting of health workers on their way home from clinics, and violent responses to mask requirements.

Developed by Insecurity Insight, a non-profit which works to examine threats facing those living and working in dangerous environments, and MapAction, the user-friendly map is intended to support the aims of the Safeguarding Health In Conflict Coalition.

Christina Wille, Managing Director, Insecurity Insight, commented, “This tool gives stakeholders concerned with the protection of health care global insight into COVID-related incidents of threats and violence against health care providers to support better protection of health workers.”

The map depicts 412 acts of pandemic-related violence and threats to health workers and services around the world in 2020 out of a total of 1,172 incidents. Because not all incidents are reported or recorded, the actual number is likely to have been significantly higher.

To create the map, MapAction needed to consolidate the data available – which is often in indigestible formats and from multiple sources – understand the geographical context and visualise it. We brought our considerable experience in humanitarian mapping, information management, and solution design to the project, ensuring the information architecture is a stable platform that is easy to manage, while allowing for future adaptations and enhancements to be seamlessly integrated.

Christina continued, “We are working with MapAction to expand the map’s functionality and develop a similar tool for the education sector and other areas, as well as a map on security incidents affecting aid operations in Mozambique.”

View the press release here.

Helping to build new Caribbean Risk Information System (CRIS)

Launched today, the Caribbean Risk Information System (CRIS) is a “one stop shop” for gathering and sharing information and data on disaster risk management and climate change adaptation across the Caribbean region.

The CRIS platform has been created by the Caribbean Disaster Emergency Management Agency (CDEMA) in collaboration with the World Bank and other partners including MapAction, with financial support from the European Union (EU). 

CRIS aims to support informed decision making by providing access to information on all types of hazards, including climate-induced hazards, as well as guidance on how to reduce risk, build disaster-resilient states and promote sustainable development. It consists of a Virtual Library, databases and the GeoCRIS – a geospatial component which provides access to geospatial data needed for risk and hazard mapping, disaster preparedness and response operations. Data from the Caribbean Handbook on Risk Information Management (CHaRIM) GeoNode has been integrated into the GeoCRIS to facilitate evidence-based decision making and development planning processes.

Screenshot of GeoCRIS showing map of Western Haiti with seaports, airports, points of interest, health facilities, river network and waterbodies map layers selected
Screenshot of the GeoCRIS showing a map of part of Western Haiti with several map layers selected

MapAction provided advice on strategic, technical and personnel issues related to creating the GeoCRIS, based on its years of experience of developing similar systems. We particularly assisted in defining
needs for data and tools to support the Rapid Needs Assistance Team (RNAT) and other rapid-response mechanisms within CDEMA as we have partnered alongside CDEMA following several devastating hurricanes in the past five years. We will also be helping CDEMA to train disaster management teams across the Caribbean region in using GeoCRIS once travel restrictions are lifted.

We’re grateful to the USAID’s Bureau for Humanitarian Assistance for funding our participation in this project.

You can view the CRIS launch presentation on the CDEMA Facebook page.

Partnering to support education in Mexico

MapAction is working in close collaboration with our partner CartONG to provide GIS & information management support to UNICEF – another long-term MapAction partner – on an as-needed basis around the world.

UNICEF logo

Working with UNICEF’s head quarters, country offices and partners in different parts of the globe, we are focusing on helping with geospatial data collection and management, mapping, knowledge management and capacity building.

One of the projects we have been collectively working on is a data analysis dashboard to help educators in Mexico respond to the COVID-19 pandemic. This dashboard, which is updated on a daily basis, is a dynamic, interactive visualisation of information enabling education teams to monitor changes and identify trends in school attendance following COVID closures. It also provides general information on the state of schools’ water and sanitation infrastructure.

Screenshot of Mexican schools dashboard showing map of Mexico and numerical variables with sample data
Screenshot of the dashboard showing sample data

The dashboard is currently in beta. When finalised, it is planned that all teachers across Mexico will have access to it to help them plan and respond to the evolving COVID crisis.

As well as helping CartONG to build the dashboard, MapAction has provided data processing scripts to ensure a seamless feed of data and has lead on the user testing and quality assurance aspects of the project.

MapAction contributes to webinar on emerging urban challenges

Aerial view across the suburbs of a city to the sky scrapers of the central business district on the horizon.

Two MapAction members contributed to a one-hour discussion of how use of collaborative networks and advances in geospatial technology can improve humanitarian outcomes in urban settings. Professor Melinda Laituri of Colorado State University and the Secondary Cities initiative was Chair of the event, with talks from Alan Mills and Chris Ewing, both of MapAction.  

Entitled Cities, humanitarianism and using geospatial analysis to mitigate risk, the online event looked at collaborative approaches to addressing global humanitarian issues.

Alan Mills and Chris Ewing shared insights gleaned from their work aimed at supporting urban resilience and emergency preparedness and response, in particular through working with, building, supporting and mobilising civil society networks. They also discussed recent technical innovations such as automated mapping.

This was followed by a question and answer session exploring some aspects further as questioned by the audience.

Chaired and Hosted by:

Speakers

  • Chris Ewing, MapAction Trustee and Volunteer – a keen physical geographer, Chris has over 10 years’ experience in the (re)insurance and engineering sectors. In his day job at Aon Impact Forecasting, Chris helps organizations better quantify natural catastrophe risk. He has volunteered with MapAction since 2007.
  • Alan Mills, MapAction Consultant and Volunteer – a volunteer since 2005 and former trustee, Alan also leads on building data preparedness partnerships. He has his own consultancy business specializing in GIS and remote sensing in international development and has 30 years experience in operations.

The full one hour Webinar can be viewed below.

COVID-19 modelling with the Centre for Humanitarian Data

Since March this year, a MapAction data scientist has been based at the Centre for Humanitarian Data in The Hague, supporting its workstream on predictive analytics. The aim of this important work is to forecast humanitarian emergencies and needs in order to trigger responses before a disaster occurs.

One of the projects the Centre’s predictive analytics team is working on, in partnership with the John Hopkins University Applied Physics Laboratory and individual country offices of the UN’s Office for the Coordination of Humanitarian Affairs (OCHA), is the development of COVID-19 modelling tailored for each country’s specific context. This seeks to predict the scale, severity and duration of the outbreak within each country, including its likely effects on particularly vulnerable groups, such as people at risk of hunger or those using solid fuel indoors for cooking.

The project is also modelling the effects of non-pharmaceutical interventions (NPIs) such as curfews, travel bans and face masks, according to what is locally viable.

The inclusion of country-specific factors, looking at projections for specific vulnerable groups as well as the general population at a sub national level, can make this work particularly helpful for governments and humanitarian organisations to inform their COVID planning.

Projected total infections per 100,000 inhabitants in Afghanistan on 2020-08-03. Projections are obtained by simulating local transmission in each district in Afghanistan and expected spatial and temporal spread between districts. Country-specific risk factors are included in the simulation at the subnational level.
German Humanitarian Assistance logo

The initial model was developed for Afghanistan and is now being extended to other priority countries including the Democratic Republic of the Congo, South Sudan and Sudan. 

We’re grateful for the support of the German Federal Foreign Office which funds MapAction’s data scientist role.

MapAction strengthens partnership with CartONG

MapAction and CartONG, a French NGO specialised in humanitarian information management, have been working together closely on several projects in recent months.

Laptop screen displaying the front page of the MoU with MapAction and CartONG logos visible

Most recently, we have been providing support to CartONG to help deliver a global information platform for MSF and working with them to provide a national education dashboard for Mexico, as part of our joint long-term agreement with Unicef.

Our partnership has now been formalised by the signing of a Memorandum of Understanding (MoU) by MapAction’s Chief Executive Liz Hughes and CartONG’s Technical Director Sandra Sudhoff. The new agreement sets out how we will work together in future to help each other achieve our charitable purposes.

Liz commented, “This agreement underlines our mutual commitment to collaborate even more in future so that we can strengthen and amplify each other’s work. Our charitable objectives are quite closely aligned, but we each bring different skill sets, relationships and expertise to the table. Collaboration is essential to everything MapAction does, so it’s great to be able to cement our partnership in this way.”

Montage of two photos, Liz Hughes doing a thumbs up to camera and Sandra Sudhoff signing the MoU at her desk, smiling to camera.