How to speed-up risk data collection, a collaboration between MapAction and Analytics for a Better World

By: ABW Data Scientist Dr. Claudia Orellana-Rodriguez , ABW Outreach and Event Manager Irina Ioniță, Pipple Data Scientist Sanne van den Bogaart & MapAction Head of Data Science Daniel Soares

The key step of any data and analytics project? Data, data, data, and did we mention collecting the right data? Easier typed than executed! A new partnership between MapAction and Netherlands-based Analytics for a Better World sought to give a new life to data trapped in PDFs – unlocking another data barrier for humanitarian response.

Better data = more lives saved. Photo: Peace,love,happiness from Pixabay

When data sources are in well-structured, actionable, and most importantly accessible formats this task is very simple, otherwise however… it can be as time-consuming as working with Internet Explorer in 2024. So, how to keep data-collection a task that can boost your efficiency (and enthusiasm) for a data and analytics project? 

MapAction, Analytics for a Better World, and Pipple joined forces in 2024 for an information extraction pilot project with the aim of speeding-up the data collection for risk projects to see how exactly that can be accomplished.

How does MapAction take action?

MapAction is an international charity based in the United Kingdom specialising in Information Management for Disaster Response and Preparedness. Founded in 2002, MapAction staff and 75+ volunteers and have since deployed to more than 140 emergency responses and 500 preparedness and capacity building missions.

MapAction has a hybrid make-up, with 32 staff members and 75+ highly skilled GIS and data volunteers. In recent years, MapAction has developed new areas of work, including Disaster Risk Reduction, Anticipatory Action, Health and Technology and Innovation. In the last months we have, for example, deployed to emergency responses in The Gambia, Belize, Grenada and St Vincent and the Grenadines, developed risk and anticipatory action projects in Eswatini, Madagascar, Ecuador and Colombia, worked with children vaccination information in several countries in West and Central Africa and supported data quality standards with OCHA.

What is MapAction? A brief animation

Collaborations for Impact

Analytics for a Better World is a Netherlands based non-profit organisation as a joint effort between ORTEC and the University of Amsterdam. Their vision centres analytics as a powerful tool to reach the Sustainable Development Goals. Analytics for a Better World brings together the combined strengths of nonprofits, the academic, and the business world around the theme of SDG-related analytics in several activities. To empower nonprofits, they educate their C-level executives, management, and specialists in how to use analytics to further their objectives. To deepen their support for nonprofits in creating impact with analytics, they build analytical roadmaps and jointly deploy analytics projects. Some of their most inspiring collaborations have been with the Ocean CleanUp, the 510 Dutch Red Cross Initiative, and their annual fellowship bringing together NGO workers and data specialists from all over the world. Next to that, they conduct and stimulate applied research on analytics aimed to contribute to the SDGs. Because accessibility of knowledge has an impactful role, they share everything they create as open source through their repository.

Pipple is a data & AI agency based in Eindhoven, the Netherlands. They are a team of creative mathematicians and engineers, specialised in solving complex issues through data & AI. Pipple was founded in 2016 and since then has provided more than 200 successful solutions to their customers. They have also had ongoing collaborations with various nonprofit organisations such as the Red Cross, the Ocean Clean-Up and more recently with Analytics for a Better World. 

Working with the INFORM Subnational Risk Index 

Firstly, what exactly is the INFORM Subnational Risk Index?

An INFORM Subnational risk index shows a detailed picture of risk and its components within a single region or country. It covers not only hazards exposure (e.g. earthquakes, floods and conflicts) but also a country’s vulnerabilities, such as diseases prevalence and poverty, as well as its coping capacity.

An INFORM Subnational risk index shows a detailed picture of risk and its components within a single region or country. It covers not only hazards exposure (e.g. earthquakes, floods and conflicts) but also a country’s vulnerabilities, such as diseases prevalence and poverty, as well as its coping capacity.

Since July 2023, in partnership with the European Commission’s INFORM Risk Index, MapAction is working to support national and subnational disaster managers to update or rebuild their disaster forecasts, mitigating tools, and risk atlases. During this period, it has worked on projects in Eswatini, Saint Kitts and Nevis, Niger, Lebanon and Madagascar.

MapAction volunteer Tom Hughes presenting the INFORM methodology during MapEx2024, MapAction’s annual simulation exercise. Photo: MapAction

An important part of an INFORM Risk project is Data Collection on hazards, vulnerability and coping capacity. Because we are looking for subnational data (region, department, district, etc.), we sometimes find this data in a PDF-text report instead of a spreadsheet or a geospatial file. Data often finds its death in PDF-texts due to its format inaccessibility, therefore having a basic tool that allows one to scan big reports in search of tables and/or key indicators would save lots of time.

Data often finds its death in PDF-texts due to its format inaccessibility, therefore having a basic tool that allows one to scan big reports in search of tables and/or key indicators would save lots of time.

A new life for data trapped in PDFs

For this pilot project between MapAction, ABW and Pipple, the target was to develop a tool that takes as input one PDF file and gives as an output one or several spreadsheets with the data indicators per administrative division, plus any relevant metadata. The tool should be able to accommodate multiple languages and be written as a Python script. 

READ ALSO: Accelerating humanitarian response: Inside MapAction’s Automated Data Pipeline

This project was expected to have following impacts:

  • Reduce the time needed to collect data from national or subnational reports,
  • Enable the exploration of a larger set of reports and sources,
  • Increase risk model completeness and enable national and regional disaster management agencies to make more informed decisions.

After the initial development phase by ABW and Pipple, MapAction now enters the utilisation phase where their team will adapt the scripts to its workflow and ongoing projects.

Because accessibility of knowledge betters the world, Python scripts and user instructions are open source and available on ABW GitHub public’s repository.

Information management professional development for emergency response agencies and partners is a key part of MapAction’s work. Photo: MapAction

How did we make this happen?

Upon first inspection of the sample PDF files, it became clear that we needed to explore different open-source Python libraries to see how they handled non-standard table structures within the documents. 

Among the first packages that we explored were:

  • Camelot – https://camelot-py.readthedocs.io/en/master/index.html
  • Tesseract-ocr – https://github.com/tesseract-ocr/tesseract

Both libraries worked well with standard tables, e.g., vertical tables with a single row header and well defined columns; however, when it came to more varied formats, they did not manage to identify the tables correctly.

In continuing our exploration, we tested one more library:

GMFT is a toolkit for converting PDF tables to many formats. It is lightweight, modular, and performant. While still under development, it already works very well and has outperformed the packages tried before. Thus, it was chosen as our final approach in the project. The package works out of the box; however, small alterations were required for better performance for our specific project. 

What comes next?

The information extraction code developed over this pilot project will have its first application on MapAction’s support to the Southern African Development Community (SADC) regional subnational INFORM Risk Index. SADC is composed of 16 countries, home to over 360 millions people and over 200 level-1 administrative divisions, which is the granularity of the model. Given the scale and level of detail of this model, information will be assembled from different national reports and the tool developed during this project will be very useful to process a large amount of data efficiently. The project will run from September 2024 to July 2025 in a collaboration between the SADC DRR unit, MapAction, GIZ and UNDP, building from the experience gathered on recent projects in Eswatini and Madagascar.

READ ALSO: How MapAction is using data to reduce human suffering in Madagascar

VIEW ALSO: Madagascar (Video): Impact of MapAction Anticipatory Action programmes

The information extraction code developed over this pilot project will have its first application on MapAction’s support to the Southern African Development Community (SADC) regional subnational INFORM Risk Index.

MapAction team members Daniel Soares and Anne-Marie Frankland, left, in blue t-shirts, together with representatives from United Nations Development Programme (UNDP), the National Disaster Management Agency of Eswatini, and other Eswatini agencies and ministries during the INFORM handover workshop in December 2023. Photo: MapAction.

Better Together – MapAction & Analytics for a Better World

We hope this first pilot project will be the beginning of a long-term collaboration between MapAction and Analytics for a Better World. Both organisations share the same core values of improving lives and reducing suffering through data and technical expertise. This project speaks directly to ABW’s vision of connecting the private sector with the non-profit one, with Pipple’s Data Scientist, Sanne van den Bogaart, playing a key role in the development of the tool.

We hope this first pilot project will be the beginning of a long-term collaboration between MapAction and Analytics for a Better World.

In June 2024, MapAction held its own annual disaster simulation exercise, MapEx, in the Peak District in the UK. This was the 18th and largest ever edition, featuring partners from the British Red Cross, UN agencies and more. More than 100 MapAction staff, volunteers, partners, donors and observers took part in the two-day ‘emergency datathon’ simulation, with some teams working on anticipatory action components for the first time.

READ MORE: Simulating anticipatory actions as part of disaster management: MapEx 2024

After the success of 2023’s edition, the ABW annual conference had its 2024 edition on May 14th. At this conference, an array of speakers and panellists representing ABW’s key stakeholders was gathered: nonprofits, researchers, and companies. Together, we reflected on the impact and progress of ABW, sharing achievements, and outlining future plans. Engaging discussions delved into pressing topics in analytics, including the challenges posed by AI. 

READ MORE: The ABW Annual Conference

The MapAction side of this work was part of a broader programme on Anticipatory Action funded by the German Federal Foreign Office’s Humanitarian Assistance programme.

Accelerating humanitarian response: Inside MapAction’s Automated Data Pipeline

In times of crisis, timely and accurate geospatial data is crucial for effective humanitarian response. This GIS Day 2024, we discuss a new project: an automated data pipeline to streamline the collection and preparation of essential geospatial datasets for emergencies. By replicating the data scramble process our GIS teams typically perform during emergencies, the MapAction Automated Data Pipeline aims to expedite the delivery of critical information to those who need it most.

By: Evangelos Diakatos, MapAction Data Engineer

By automating the acquisition of these datasets, the pipeline aims to improve efficiency by reducing the time required to gather and prepare data during emergencies. It enhances accuracy by providing up-to-date and consistent datasets for mapping and analysis, enabling the GIS team to focus on critical analysis and map production rather than manual data collection. This supports a more rapid and effective humanitarian response.

Data Sources

The pipeline integrates data from several key sources. One of the primary sources is the Humanitarian Data Exchange (HDX), a platform hosted by OCHA that offers a wide range of humanitarian datasets. HDX provides access to critical information necessary for planning and coordinating emergency responses.

Another important source is Google Earth Engine (GEE), a cloud-based platform that facilitates the processing of satellite imagery and other geospatial datasets.  Additionally, the pipeline retrieves data from OpenStreetMap (OSM), a collaborative project aimed at creating a free, editable map of the world. OSM provides detailed geographical information, including roads, buildings, and points of interest.

Figure: Example of baseline map made by MapAction on past emergency responses. Our new data pipeline aims to automate the acquisition and processing of data used in these maps, such as administrative boundaries, transport infrastructure and geographic features

The datasets collected and processed by the pipeline are mainly the data needed in the first moments after the onset of an emergency. They describe the country or region’s situation before the emergency and form the baseline of our maps, which will be enriched with situational information as the emergency develops. One can mention for example administrative boundaries, geographic features such as rivers and lakes, population distribution and infrastructure (e.g., roads, airports, hospital).

Technology stack

All of these datasets are gathered mainly through APIs. APIs, or Application Programming Interfaces, are sets of rules that allow different software applications to communicate with each other. By interfacing with various APIs, the pipeline is able to fetch the latest data directly from the source. This ensures that the information used in analyses is both up-to-date and consistent, providing a reliable foundation for emergency response efforts.

Pipeline architecture showing the different steps, from data acquisition to storage.

The MapAction data pipeline  is constructed using a combination of Python and Bash scripts. Python is a versatile programming language known for its readability and extensive libraries, making it ideal for data processing tasks. Bash scripts facilitate the automation of command-line operations in a Linux environment.

To ensure portability and consistency across different computing environments, the pipeline operates within a Linux Docker container. Docker is a platform that uses containers to package applications and their dependencies, allowing for seamless deployment across various systems .

Process orchestration is handled by Apache Airflow, an open-source workflow management platform. It enables the scheduling and monitoring of workflows, managing task dependencies, and ensuring that data processing steps occur in the correct order.

Next steps

The next phase for the MapAction Automated Data Pipeline involves rigorous validation of the results and testing during actual emergency responses. By integrating the pipeline into live operations, we can assess its effectiveness and make necessary adjustments. Initially, the tool will be made available for internal use within MapAction, allowing our GIS team to benefit from its capabilities while we continue to refine its functionality.

In the future, we aim to adopt an event-driven pipeline approach, enabling automatic initiation of data processing in response to specific triggers such as GDACS disaster alerts. Additionally, we plan to develop an interactive dashboard that allows for manual configuration of pipeline runs, giving users greater control over data collection parameters.

Ultimately, after thorough internal testing and refinement, we hope to make the pipeline available to the broader humanitarian community. By sharing this tool publicly, we aim to support other organisations in enhancing their emergency response efforts through improved data accessibility and efficiency.

MapAction’s work in humanitarian response is funded by USAID’s Bureau for Humanitarian Assistance (BHA) and the German Federal Foreign Office’s Programme for Humanitarian Assistance.

MapAction looking for volunteers to unlock information management barriers in humanitarian sector

MapAction is looking to fill six new volunteer positions with candidates who have the right skills to support work in the following fields: geospatial, development of geospatial training content, data science, data visualisation, software development and data engineering. Help MapAction and the humanitarian sector mitigate climate change and health emergencies through innovative use of software, geospatial technology and training, visualisations and data solutions.

Every day we hear news of how climate change is having devastating consequences for communities worldwide. As the effects become more clear and prominent – floods, droughts, hurricanes and natural disasters  – it is easy to feel helpless before the mitigation task at hand. 

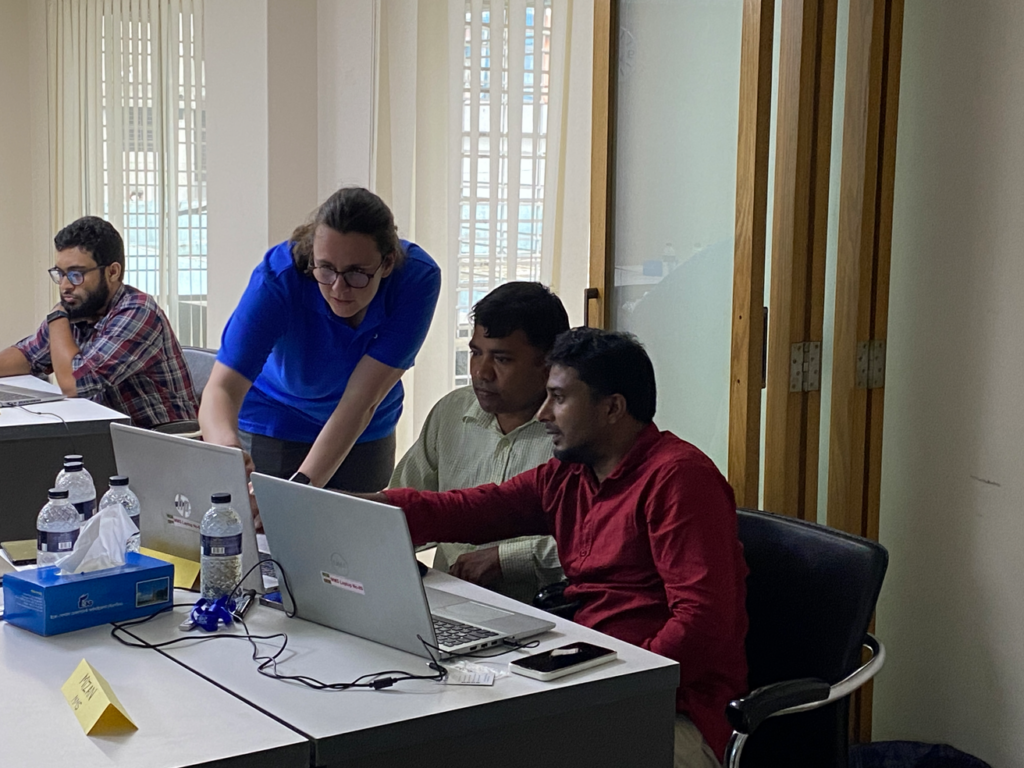
At MapAction we are working to strengthen early warning systems, anticipatory humanitarian action, so that communities exposed to climate change and health emergencies can be more prepared and resilient. 

Frontline communities affected by a health or climate emergency depend on humanitarian agencies getting decisions right. These decisions, in turn, depend on good use of data. 

At MapAction, we are always looking for innovators who can bring their skills and experience to create data solutions that can support saving lives in humanitarian disasters. That is why we are inviting a software developer who can unlock information management barriers with innovative data solutions, a data engineer who can unlock devops challenges and review data and code hygiene issues, as well as a data scientist who can design innovative data-delivery breakthroughs for humanitarian agencies and partners. The geospatial volunteers will help us to continue to place the benefits of mapping and geospatial analysis at the service of humanitarians. 

Data scientist and data visualiser

The data scientist performs statistical analysis of geospatial data and helps us create data visualisations and dashboards. They review literature, collaborate with partners and help design and provide internal and external training. The data visualiser, on the other hand, will maintain the highest standards for visual communication, produce and test reports and dashboards, as well as charts and infographics. Each of these roles will work closely with the others. 

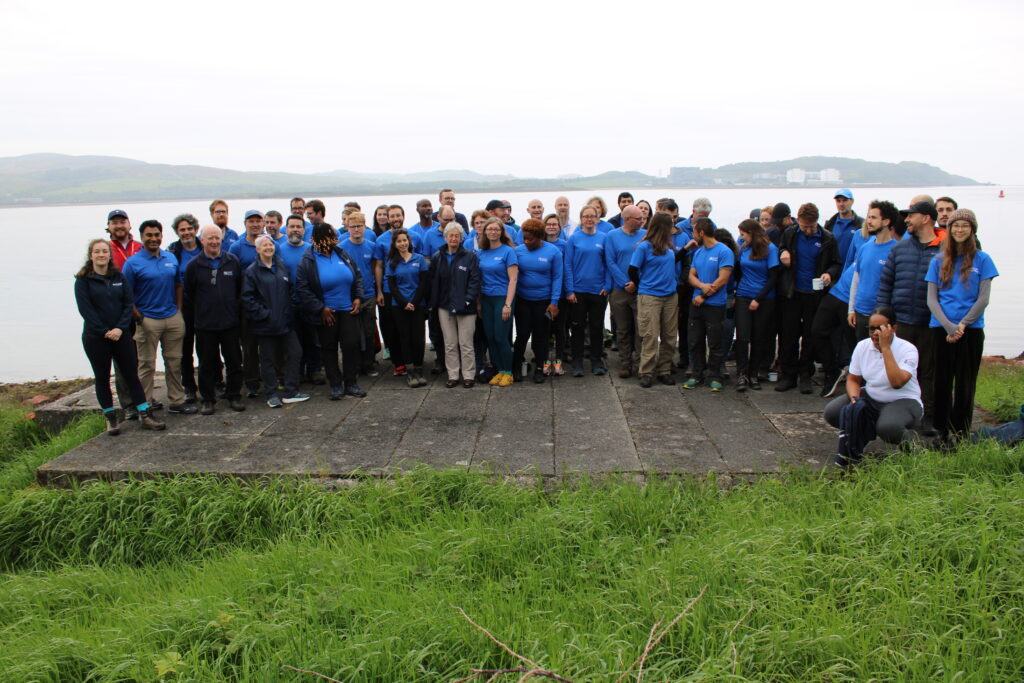
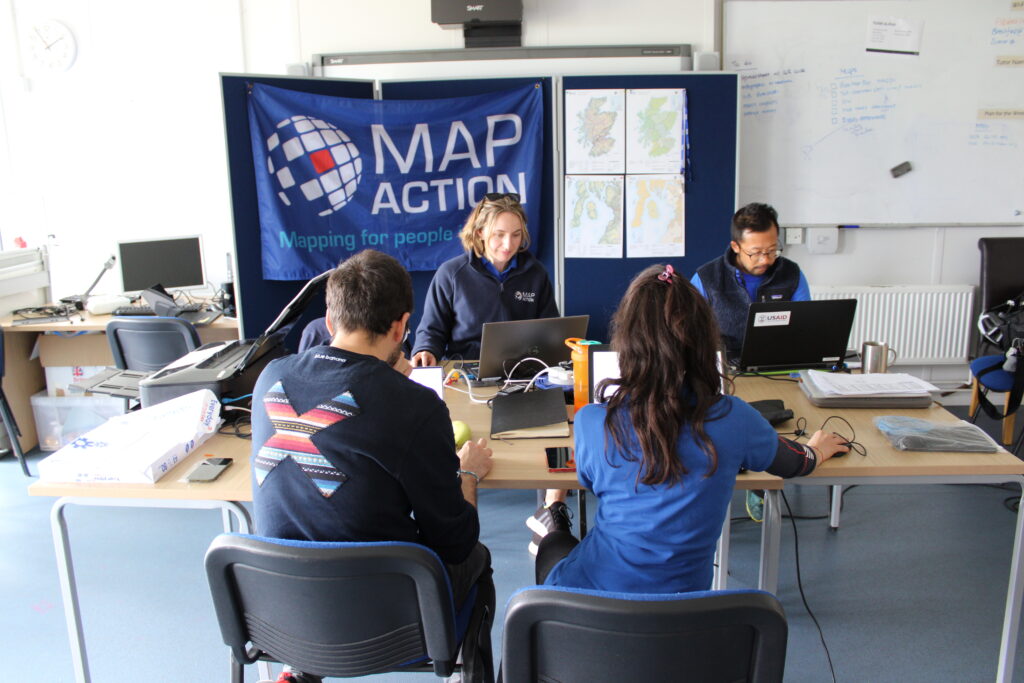
IN IMAGES: MapAction conducts simulated volcanic eruption response exercise on Isle of Cumbrae

Each role, however, is designed to streamline the work MapAction does: delivering a more efficient and data-driven humanitarian operations field, to support decision-makers in getting it right, so that lives are not needlessly lost or negatively affected. For a data engineer this might mean running a prototype environment to review how MapAction integrates software projects alongside mapping/data projects. It might mean cleaning script redevelopment – code hygiene – or deploying source controlled python scripts into a project workspace. For a data scientist, it might mean working with a software engineer or a specific disaster model or a tool to support early warning or relief decisions. Data and software engineers will also review coding standards and guidelines. 

Geospatial specialists

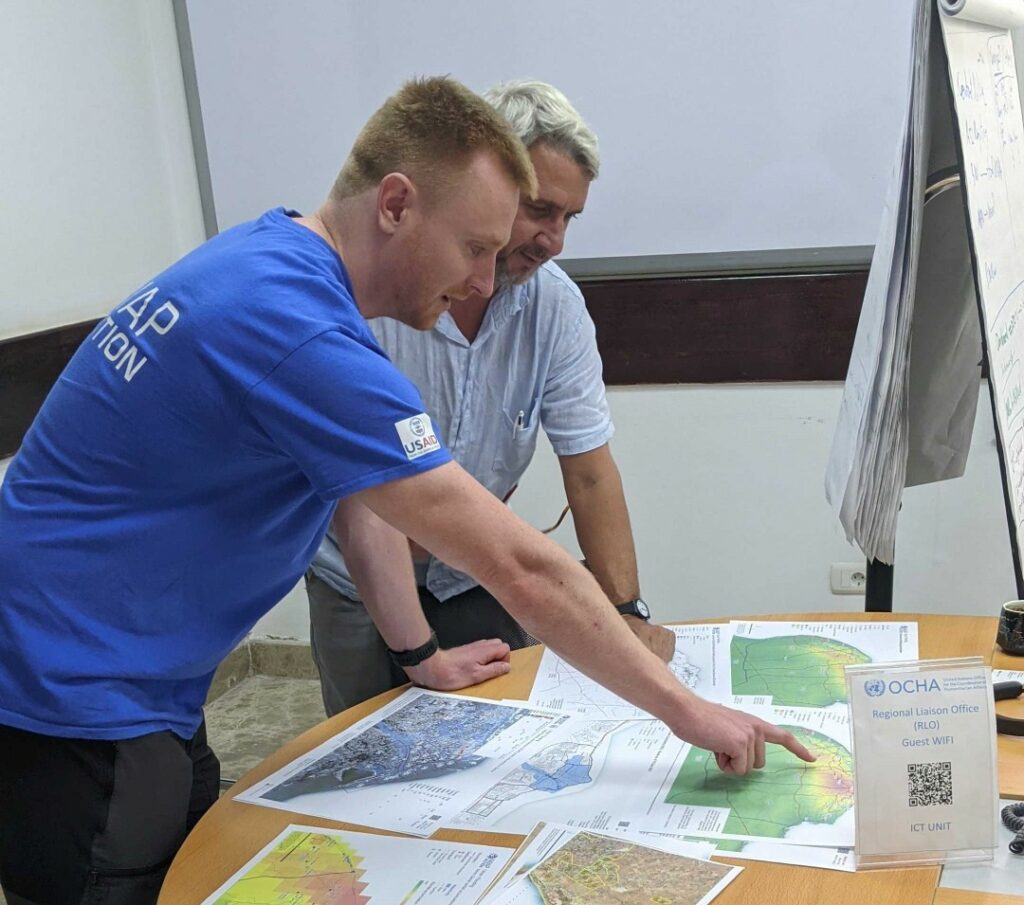
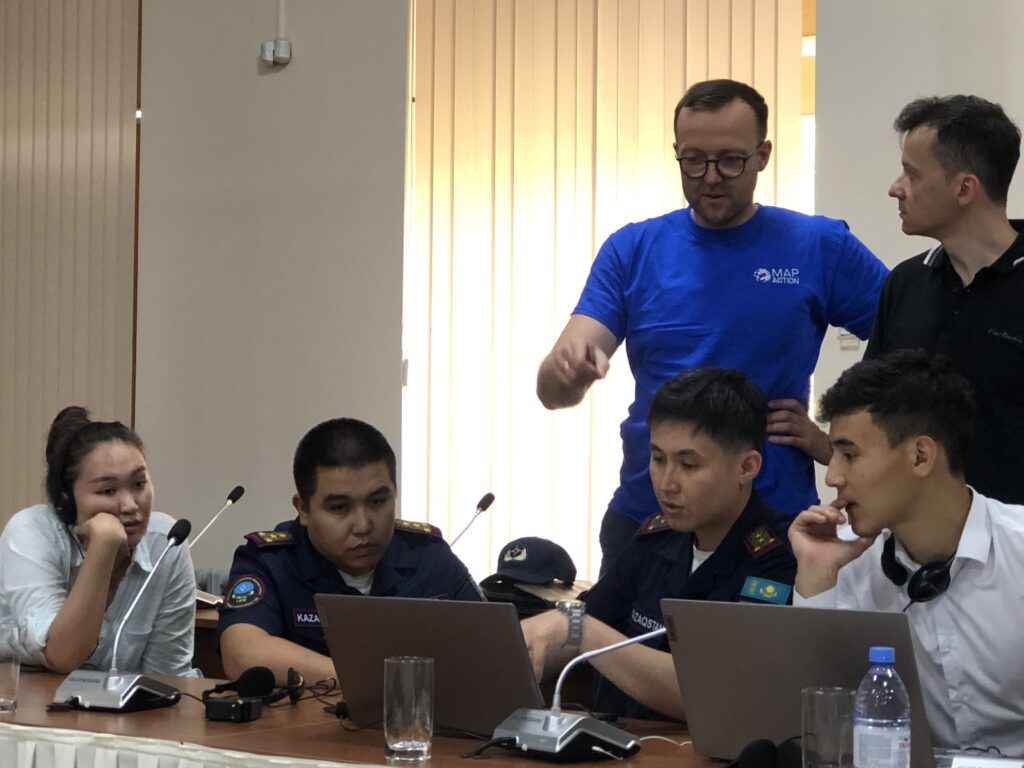
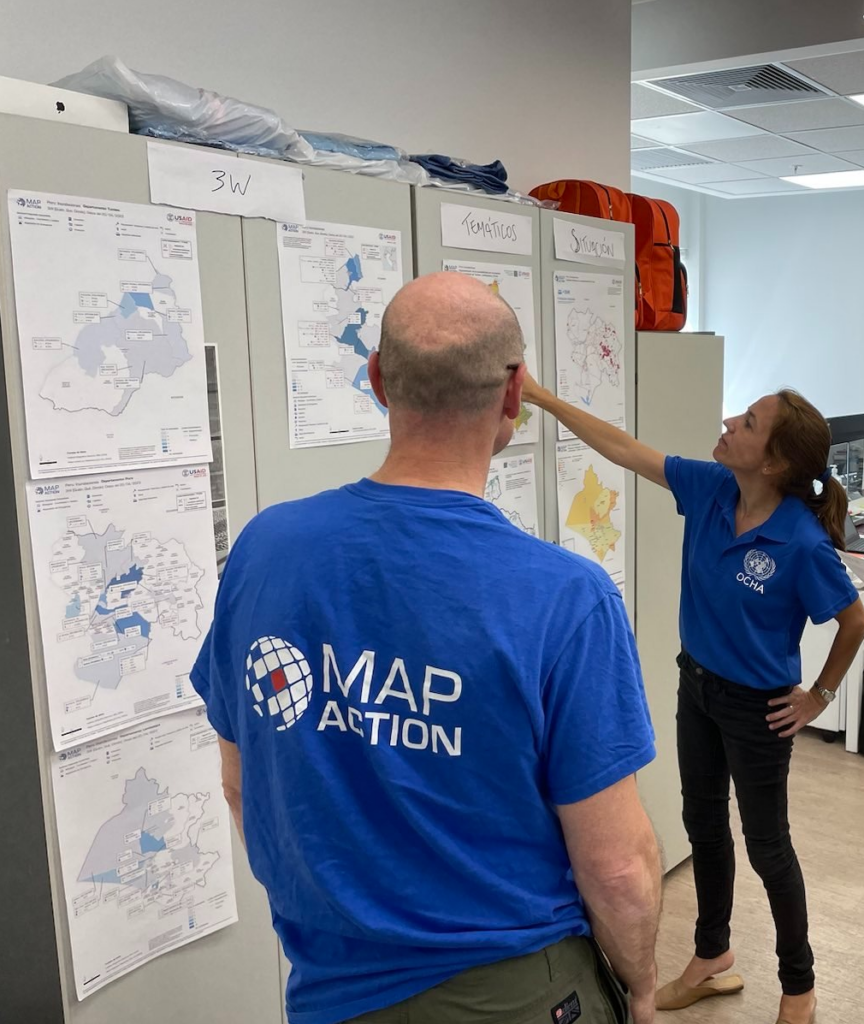
For a geospatial volunteer, it might be one map that opens up a huge aid solution or unlocks critical early funding for a CSO or humanitarian resilience network. In 2023 alone, our geospatial volunteers have responded to major crises alongside the UN in Turkiye, Libya, Kosovo and Peru. As a geospatial training content developer, you might engage in any number of activities: from providing support to CSOs in Southeast Asia or Southern Africa, to working with regional partners like the Caribbean Disaster Emergency Management Agency (CDEMA) or developing simulation for specific disasters, such as hurricanes. 

Many of these roles will entail opportunities to travel and work with some of the world’s leading humanitarian organisations: from the UN, WHO or WFP, to regional disaster response coordinators in four continents. 

READ ALSO: MapAction disaster mapping volunteers supporting UN on response to floods in Libya

Working closely with MapAction’s inhouse tech and geospatial departments – which include software engineers and data scientists –  as well as the UN’s Centre for Humanitarian Data in the Hague and other global partners, whoever fills these roles will get the opportunity to develop software, maps, training programmes, visualisations and data solutions that will broadly impact the humanitarian sector, as well as regional and national disaster relief agencies. These will pave the way for long-term impact and resilience. Working closely with national disaster agencies through the Start Network and INFORM, our innovation and tech team review national disaster models and preparedness worldwide, with a frontrow seat to enact sustainable change.

It is an opportunity for people with the right tech skills to see how the wider humanitarian system operates from the inside and where data and geospatial solutions play a role:  a front row seat to understand global trends and pressures driving world events and their consequences on people

Volunteers also provide vital support to UN agencies and other partners in emergency operations centres worldwide, both in-person and remotely. MapAction has been involved in more than 140 emergency responses worldwide in the last 20 years. 


Like what you’ve read and want to get involved? Please click here to see the full list of roles and to apply.

This work is made possible with funds from USAID’s Bureau of Humanitarian Assistance (BHA)

Volunteer intake boosts skills and capacity

2021 volunteer intake - four new volunteers with Mapction T-shirts smile at the camera in an office with a map behind them.
From left: Chris Tilt, Cate Seale, Piet Gerrits and Yolanda Vazquez

MapAction’s work is built around the skills and dedication of its volunteers. They work in numerous different fields in their day jobs and join us to undertake emergency and planned assignments both around the world and remotely. 

This year, after a careful selection process, we are delighted to welcome two data scientists, a data engineer and a GIS expert onboard. They will help us to broaden and diversify our skill base and increase our analytical capacity. 

We are now beginning the process of equipping the new intake with additional knowledge and competences they’ll need to function effectively in humanitarian contexts.

Chris Tilt (Data engineer)

My background is software development, primarily with .NET.  I find building software fun when it helps people or when it solves an interesting problem. 

Having not worked in this sector previously, for me the learning curve may be steep to begin with.  However, joining MapAction is an opportunity that’s hard to find.  There are many interesting people here and the work speaks for itself, so I’m looking forward to getting involved!

Outside of work or my interest in tech, I’m an avid runner, and enjoy learning new things, civilised arguments about politics and Scandinavian crime thrillers. 

Cate Seale (Data scientist)

I was always torn between the academic and creative. Mapping and data science allows me to do both. I like thinking about the art of the possible, and figuring out and implementing algorithms. But also making design decisions on how to communicate that information in graphs and maps.

I love the idea of people with different skills all coming together to work towards common goals of rights, respect and dignity.

In my spare time, I am addicted to podcasts! My current favourites are Heavyweight and 99% Invisible.

Yolanda Vazquez (GIS)

I am currently working as a Geospatial Consultant at the Satellite Applications Catapult where I am part of a team focused on International Development and Humanitarian work. I wanted to join MapAction because the humanitarian character of the organisation aligns with my personal and professional values, and because I know it is full of passionate map geeks like me who want to use their skills to help people affected by humanitarian emergencies.

What inspires me about the humanitarian sector are its principles and the work that humanitarians do to support people in need with respect and dignity, regardless of race, ethnicity, religion and social status.

In my free time, I love travelling and all things music related; playing, dancing, gigs and festivals.

Piet Gerrits (Data Scientist)

I am currently a PhD researcher at the University of Glasgow and work as a GIS technician at the University of Cambridge. I’m passionate about long-term human-environment interaction and so studied landscape archaeology. After being introduced to GIS and Remote Sensing, I made a career change to Geospatial Data Science and have worked on several research and capacity building projects in Turkey and Iraq that bring together historical data such as maps, censuses and (historical) satellite information. 

Joining Mapaction provides the opportunity to be part of a team that brings together spatial data with the purpose of making people’s lives better.

In my free time, I enjoy learning new things, travelling  and often go kayaking on the river Cam and elsewhere in the UK.

Using data engineering to save lives

By Egor Zverev
Egor is working with us temporarily through Google’s Summer of Code programme.

How could I apply my programming and data science skills to make the world a better and safer place? I’ve been struggling to figure that out for quite some time, and finally after three years of studying computer science at MIPT in Moscow, I found an opportunity to fulfil my dreams. 

Hi, I’m Egor, and I want to write about the impact I am making while working on my Google Summer of Code (GSoC) project at MapAction!

I decided to join the GSoC programme as I felt it was an amazing opportunity to spend my summer working on a real-world open-source project. The programme offered me 202 organisations and over a thousand projects to choose from, but MapAction stood out as the only humanitarian organisation among them, so the choice was obvious to me. I faced some stiff competition as 25 other candidates applied for this role, so I am so grateful for the opportunity to join MapAction in its mission.

My GSoC began with a bonding period, and even that was amazing! I was introduced to MapAction during one of its many training days. I listened to various lectures given by the MapAction team. I was especially inspired by Hannah’s presentation as she is working at both MapAction and UN OCHA (the UN Office for the Coordination of Humanitarian Affairs) where she’s developing an anticipatory action framework. Talking to her was a fascinating part of my GSoC experience as it made me think hard about how I could help solve some of  the world’s problems. Following that, I had a week of meeting various people from MapAction. Each encounter was special in its own way. After my first week, I already felt like I was a part of the team, an ideal time to start coding.

I have been working on the data pipeline project: a MapAction tool to automate the acquisition and transformation of data. During the early stages of emergency response, it’s crucial to gather all necessary data as quickly as possible. My goal was to extend the pipeline from three to 22 data products. This will allow for visualisation of much more infrastructure and landscape features etc. After adding the initial five products, I realised that the code required a serious refactoring as it was quite unwieldy and difficult to deal with. During the first stage I managed to fix many local problems and reduced the total amount of code by almost 30%. Going forward, I am planning to redesign the entire pipeline’s architecture and implement a new design. After this I hope to add unit tests to ensure the code is correct. 

As most of MapAction’s developers are volunteers who only work for a couple of hours per week, a simplified pipeline will make it much easier for both them and any newcomers to make sense of it and use it. My work has also increased the readability of the code and made future pipeline development much faster. 

In summary, not only have I already added many valuable datasets to the pipeline that will allow MapAction volunteers to easily understand the locations of rivers, airports, country boundaries, etc. I am also bringing fundamental changes to the project that will make the life of MapAction’s volunteers much easier. I feel very proud of the impact I am making and it is an honour for me to spend my summer working on this project.