A year of collaboration with the Centre for Humanitarian Data

Headshot of Hannah Ker outdoors

By Hannah Ker, Data Scientist at MapAction

In March 2020, MapAction and the UN OCHA (Office for the Coordination of Humanitarian Affairs) Centre for Humanitarian Data embarked on a new level of collaboration by sharing a Data Scientist’s time between the two organisations. Both teams had a lot to offer and learn from each other, with MapAction bringing its geospatial expertise to the Centre’s Predictive Analytics (PA) team. Predictive analytics is a form of data science that uses current and historical facts to predict future events. For MapAction, this collaboration also constituted an important aspect of our Moonshot, which sees us transitioning from being a passive data consumer to an organisation that actively contributes to humanitarian datasets.

2020 Highlights

Looking back on our work over the past year, we can see how this collaboration has benefitted both organisations in many ways, with numerous positive repercussions more widely. Ultimately, the fruits of our joint working are examples of how data science can help to reduce suffering and save lives in humanitarian initiatives. 

Your input leap-frogged us forward. It is amazing to me how quickly we were able to do this together. A round of applause for your work and its contribution to unlocking critically needed aid for Ethiopians.

Josée Poirier, Predictive Analytics Technical Specialist, Centre for Humanitarian Data

Preventing hunger

In the latter part of the year, a MapAction team of volunteers helped the Centre’s PA team develop analysis for a drought-related anticipatory action framework which was designed to trigger mitigation activities ahead of a predicted drought crisis. The PA team aimed to better understand the reliability of various indicators used to predict potential food shortages caused by drought in Somalia and Ethiopia. These indicators were then used to trigger an early release of funds from the UN’s Central Emergency Response Fund (CERF). The MapAction team reviewed past literature, evaluated available satellite images, and created a prototype drought model in Google Earth Engine (a platform for visualising and analysing satellite imagery of Earth). These inputs helped the PA team to flag an upcoming crisis in Ethiopia and trigger an activation for a humanitarian response. In the words of Josée Poirier, Predictive Analytics Technical Specialist from the PA team: “Your input leap-frogged us forward. It is amazing to me how quickly we were able to do this together. A round of applause for your work and its contribution to unlocking critically needed aid for Ethiopians.”
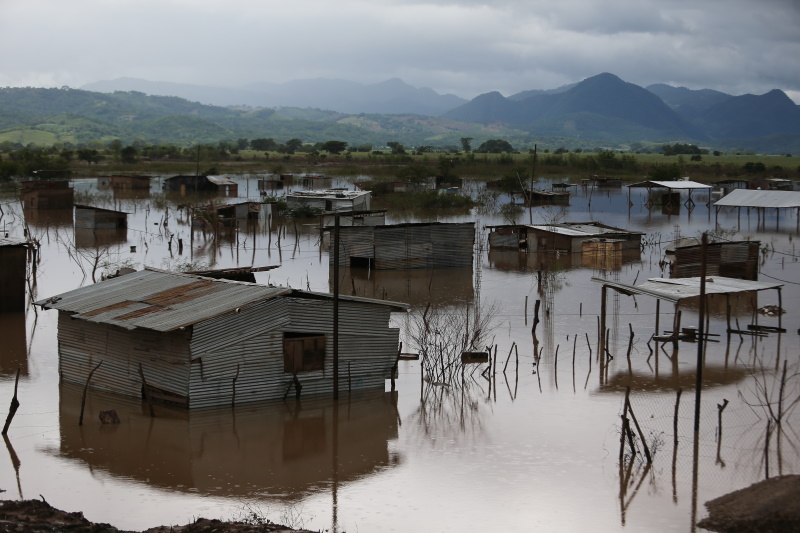
Flood mapping

The MapAction and PA teams also collaborated to implement and validate an approach for mapping flooding from satellite imagery. MapAction’s Data Scientist has been working with the PA team to help evaluate the impact of recent anticipatory action in Bangladesh which took place in July 2020 and was the fastest-ever allocation of CERF funds. To better understand how this aid was helpful to those affected, the PA team needs to know exactly when, where, and for how long flooding occurred. Contributing to this work also has direct benefits for MapAction’s own work, enabling us to add a new data processing method to our disaster-response toolbox. We then had the opportunity to test this methodology in our response to the devastating impacts of Hurricanes Eta and Iota in Central America. 
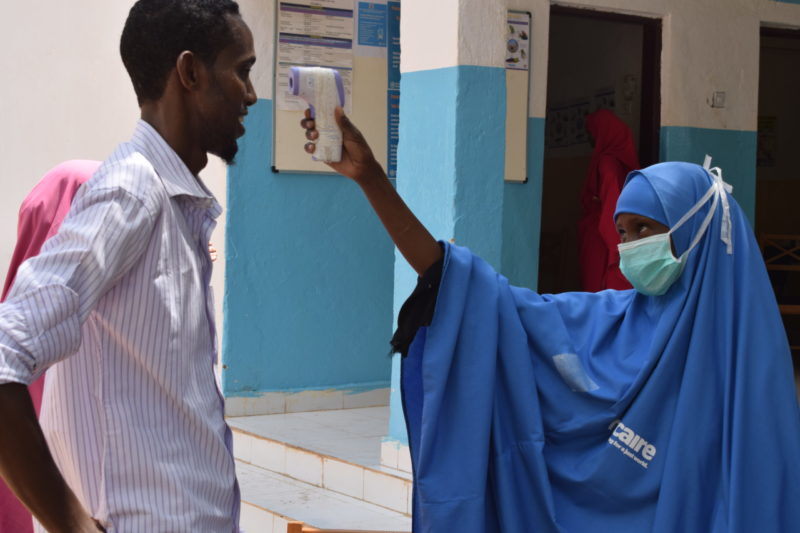
MapAction was able to test the flood-mapping methodology developed with the Centre for Humanitarian Data in the response to Hurricanes Eta and Iota in Central America. Photo: European Union, 2020 (D Membreño)

COVID-19

Both organisations have made commitments to assist in the global pandemic response. The Centre PA team and MapAction Data Scientist have, in partnership with the Johns Hopkins University Applied Physics Laboratory (APL), developed a model to forecast the number of cases, hospitalisations, and deaths due to COVID-19 for six countries, tailored to each country’s specific humanitarian needs. Named OCHA-Bucky, the model offers sub-national projections, and takes into the account the effects of non-pharmaceutical interventions. Presently, MapAction is participating in a pilot project to aid vaccine rollout in vulnerable countries by surveying the current data landscapes and identify gaps in order to address the logistical challenges inherent in such tasks. Along a similar line of work, the Centre PA team and APL are planning on adding vaccination strategies to the OCHA-Bucky model. 

animation of new COVID infections model in Afghanistan
Projected total infections per 100,000 inhabitants in Afghanistan on 2020-08-03. Projections were obtained by simulating local transmission in each district in Afghanistan and expected spatial and temporal spread between districts. Country-specific risk factors were included in the simulation at the subnational level.

Shared goals

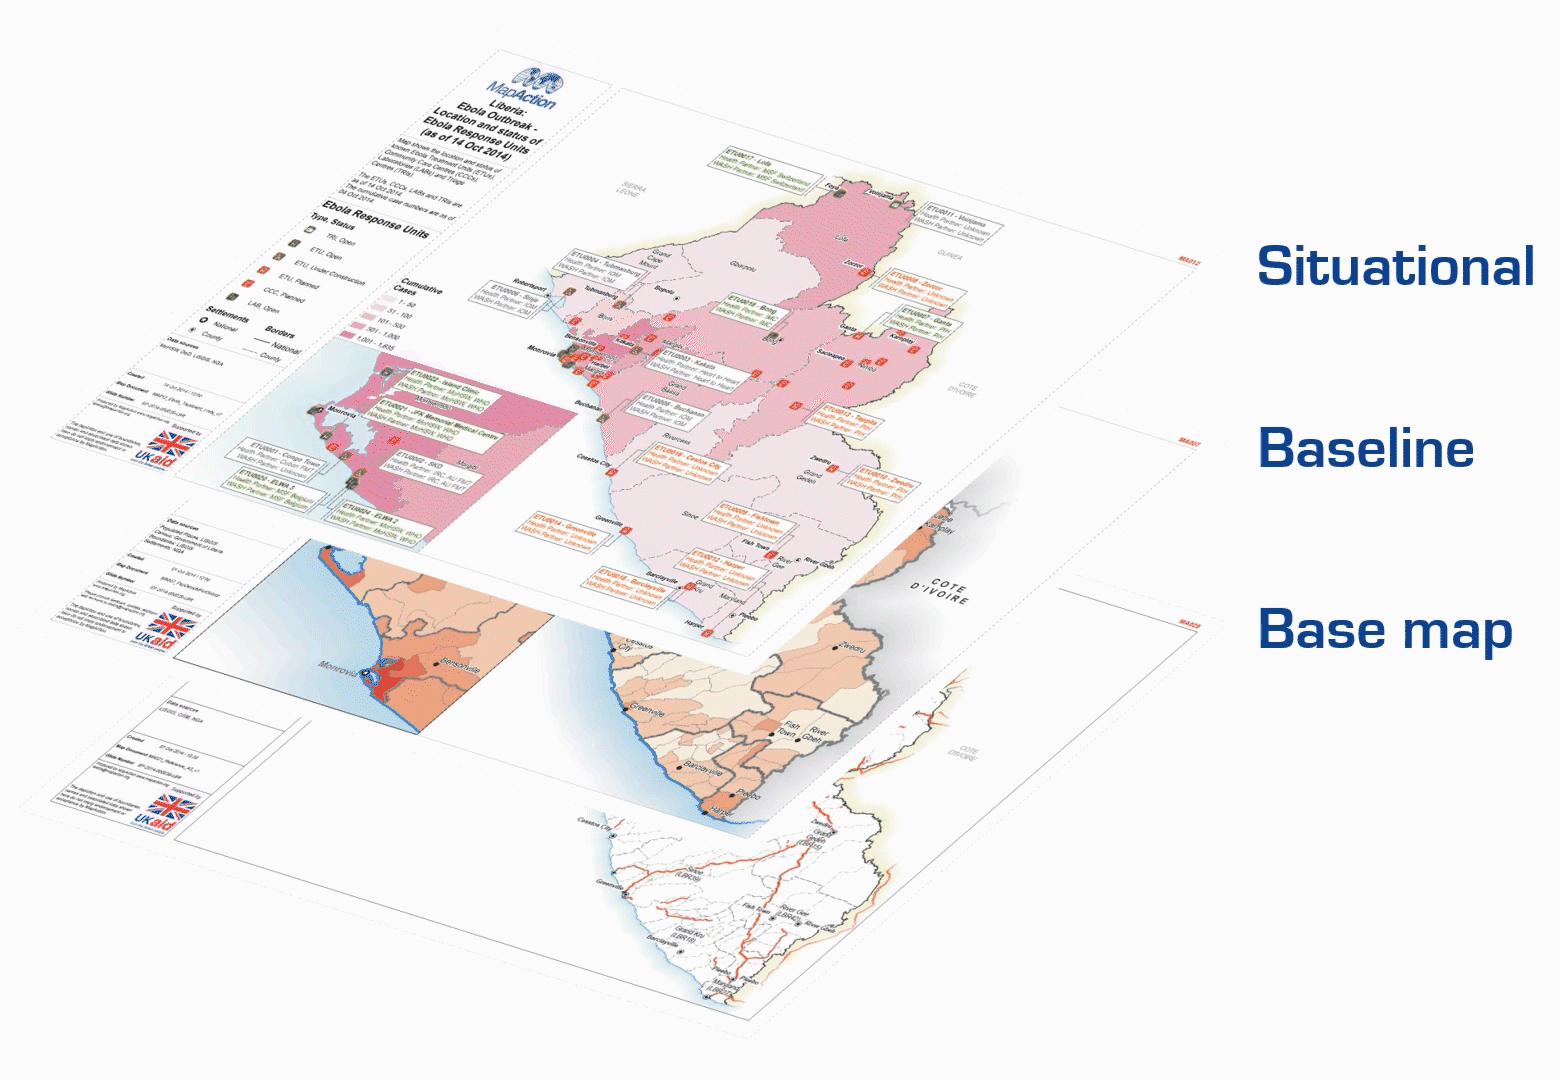
There is substantial overlap between the broad technical goals of the two organisations. The Centre’s Humanitarian Data Exchange (HDX) contains over 18,000 datasets and it has created several automatic pipelines (software that carries out a series of data-processing steps) to systematically ingest data from its partners into its database. The Centre’s technical expertise has so far been a key input into the planning and development of a similar (albeit smaller scale) pipeline at MapAction, which is being created to automate the generation of core maps as part of the Moonshot initiative. This work will ensure that base maps essential for coordinating any type of humanitarian response are immediately available whenever they are needed. 

The two organisations share similar data access platforms and are actively engaged in ongoing discussions regarding different ways to construct pipeline software. Finally, both HDX and MapAction ultimately seek to identify and rectify gaps in the humanitarian data landscape in order to ensure that those coordinating the preparations for and responses to different types of emergencies have the reliable, timely information they need. 

Looking ahead in 2021

MapAction and the Centre for Humanitarian Data are continuing to plan ways to collaborate throughout the rest of the year and beyond. 

In addition to sharing expertise in advanced analytics, we are working to make data-driven methods accessible to wider audiences in the humanitarian sector in order to improve the effectiveness of aid programmes. MapAction and the Centre’s Data Literacy team have identified an opportunity to come together to develop GIS training material. This work aims to help non-technical humanitarians make better use of geospatial data to understand the needs of affected communities and coordinate aid. 

Both teams are also collaborating to ensure that our data science workflows and models are published openly and can be used by others in the field. Inspired by initiatives such as The Turing Way, we are formalising and adopting best practices to write high quality code, document methodologies, and reproduce results. 

German Humanitarian Assistance logo

At the end of the first year of our collaboration, it is gratifying to reflect on how much we have been able to achieve together while learning from each other and expanding our collective knowledge. We’re grateful to the German Federal Foreign Office for making this work possible by funding our Data Scientist role. We’re looking forward to continuing to work together to push forward the boundaries of humanitarian data science.

What does ‘Data’ mean to MapAction?

What is MapAction’s ‘humanitarian data landscape?’ At MapAction, we’re working to put data at the centre of how we provide products and services to the humanitarian sector. MapAction’s data scientist, Monica Turner, recently posted  about the work she does in this new role. However, data is a big (and sometimes loaded) term. So what does ‘data’ mean to MapAction? We asked Hannah Ker, MapAction’s Data Scientist whilst Monica is on maternity leave, to explain. 

During a humanitarian crisis, it is vitally important for responders to have information such as which areas are most affected, where vulnerable populations exist and where relevant infrastructure & services (such as healthcare facilities) are located. MapAction provides information products (such as maps) to our partners to help them address these information needs. Unsurprisingly the vast majority of data that we work with at MapAction is geospatial. We aim to use geospatial techniques, such as cartography, to make complex data rapidlly accessible to those responding to humanitarian crises.

The ‘Layers of data’ page (see diagram below) from our Example Product Catalogue provides a useful framework for thinking about how many different datasets are processed and combined into a meaningful final product.

Firstly, we can think of the data that is input to our basemap or initial reference map of a given area. This data often reflects features such as administrative boundaries, land elevation, settlements, and transportation infrastructure. Secondly, we have baseline data that provides demographic information about the area of interest, such as population numbers and numbers of schools. 

Our last data layer includes situational information that is relevant to the humanitarian context at hand. The kinds of data relevant for this layer can vary significantly depending on the circumstances. This data is also likely to be the most dynamic and temporally sensitive. For example, it may be used to show change over time as a crisis evolves.

All of this data can come from a variety of sources. The Humanitarian Data Exchange (HDX), developed and maintained by the UN OCHA Centre for Humanitarian Data, is a repository that holds over 17,000 datasets from more than 1,300 different sources. These datasets come from what we might think of as ‘authoritative’ sources of information, such as the World Bank or the World Food Programme.

In particular, MapAction frequently uses the Common Operational Datasets of Administrative Boundaries (COD-AB) that are published and maintained by the UN Office for the Coordination of Humanitarian Affairs (OCHA). It can be challenging to access complete and up-to-date administrative boundary data, so the CODs attempt to provide standardised, high quality data that can be used to support humanitarian operations.

OpenStreetMap (OSM) also provides a valuable source of geospatial data. This ‘Wikipedia of maps’ is an entirely crowdsourced map of the world. In theory, anyone, anywhere in the world (with an internet connection) can contribute to OSM. At MapAction, we use OSM as a source of data for features such as settlements and transportation infrastructure. MapAction is a partner of the Missing Maps project, hosted by OSM which seeks to crowd source the gaps in maps in available maps.

So why can’t we just use maps that already exist, like Google Maps?, one might ask. Why all these complex data layers? Why spend so much time finding data when it’s already all there?

Platforms such as Google Maps, Waze, and Apple Maps are commonly used as day-to-day navigation tools for people in many parts of the world. However, such existing tools do not provide the flexibility that is often required when managing and presenting geospatial data in humanitarian scenarios. As these tools are privately-developed, individuals and organisations do not always have the ability to manipulate or style the underlying data to suit their needs. These platforms were not created specifically for humanitarian use-cases, and so may not always include the information that meets the operational requirements of humanitarian contexts, such as locations of damaged buildings or the extent of a flood.

OSM’s Humanitarian map style, for example, shows some of the unique data styling that may be required in humanitarian contexts. Moreover, there are many parts of the world with human settlements that are not present (or poorly represented) on existing maps, as is demonstrated by efforts from organisations such as the Humanitarian OpenStreetMap Team and the Missing Maps initiative. These challenges mean that there is no existing ‘one size fits all’ mapping platform that is capable of providing and presenting all of the information that is needed in humanitarian contexts. 

Finding high quality geospatial data is an ongoing challenge for us at MapAction. Geospatial data quality is a multifaceted concept, and includes dimensions such as up-to-dateness, positional accuracy, logical consistency, and completeness. The image below, for example, shows a geometry problem that we often face with administrative boundary data. Notice the gap in the border between Chad and the Central African Republic. Lack of standardisation in this data between different countries and organisations, or out of date data can result in such misalignment. Due to the political sensitivity that is associated with boundary data, it is important to ensure that the data that we use is as accurate as possible. 

Our ongoing work around the Moonshot project seeks to develop tools that can help us to automatically detect and address quality issues such as these. Keep an eye out for future blog posts where we will address some of these technical challenges in greater detail. 

At the end of the day, we’re working to make complex situations better understood. Humanitarian crises are incredibly complex, and accordingly, can be associated with complex datasets and information. By selecting high quality datasets and visualising them in clear and accessible ways, we intend for our humanitarian partners to be able to make informed decisions and deliver effective aid to those in need. 

MapAction’s Data Scientist is funded by the German Federal Foreign Office (GFFO), but the views and opinions above do not necessarily represent those of the GFFO.

How data science can help release emergency funds before a crisis

head shot of Monica Turner smiling to camera

Although data science is still a relatively new field, its potential for the humanitarian sector is vast and ever-changing. We caught up with one of MapAction’s Data Scientists Monica Turner to discover how data science is evolving, the impact of COVID-19 on her work and how predictive modelling could see disaster funding being released before a disaster has occurred. 

Interview by Karolina Throssell, MapAction Communications Volunteer

How did you get into data science?

I have a background in Astrophysics but wanted to transition into data science, so I started volunteering with 510 global which is part of the Netherlands Red Cross. This was my first experience in the humanitarian sector, and I was immediately hooked. After working briefly as a data scientist at a technology company, I began working at MapAction in March 2020. As part of my work, I am seconded to the Centre for Humanitarian Data in the Hague, which is managed by the United Nations Office for the Coordination of Humanitarian Affairs (OCHA).

What is the role of data science at MapAction?

Even though one of MapAction’s primary products is maps, these are created by combining different data sets. So, while the explicit presence of a data scientist at the organisation is new, MapAction has fundamentally always been doing data science on some level. With this new role, the hope is to both formalise the current data science practices, and expand our analytical capability, ultimately shifting our role from data consumer to having an active role in the development and improvement of humanitarian data sets. 

As a data scientist, you often have to wear many hats – from data cleaning to model development to visualisation. With the Moonshot project, we are looking to automate the creation of seven to nine key maps for 20 countries. One of my first tasks is to design and build a pipeline that downloads, transforms, and checks the quality of all the different data sets that make up these key maps. The details of this pipeline will be the subject of a future blog post. 

How has COVID-19 impacted on your work?

One of MapAction’s strengths is the field work that we are able to do during an emergency as well as the remote support we provide. However, as COVID-19 has limited the ability to travel, the paradigm has shifted and we need to rethink how we respond to emergencies overall. In particular, we are working to expand the types of products that we offer to our partners, as the demand increases for more remote-oriented products such as web-based dashboards. 

At the Centre for Humanitarian data, in collaboration with the Johns Hopkins Applied Physics Laboratory, we’ve been developing a model relating to the spread of COVID, to help low- and middle-income countries plan their responses.

A female medic wearing a facemask takes the temperature of a smiling man before he enters a clinic
Photo: Trócaire 

One of the main challenges of modelling COVID-19 is the novelty of the disease. Since there is no historical data, model validation becomes much more challenging. Additionally, the number of cases and deaths is a crucial input to the model. With higher income countries, more testing is done so the data we need is there, however the availability and quality of this data in low- and middle-income countries poses a further hurdle. Nevertheless, even with these caveats it is still very valuable to provide low- and middle-income countries with a tailored scenario-building tool for developing their COVID response.

Where is data science heading?

Predictive analytics will play a much larger role in the future of data science. The UN is currently working on a huge project to provide funding for predictive models that will enable it to release funding from the Central Emergency Response Fund (CERF), to help communities prepare and protect themselves from disasters before they occur. After a successful pilot project in Bangladesh, we plan to extend our model validation to other types of disasters such as cholera and food insecurity.

At MapAction, the Moonshot will lead a shift towards preparedness and enable us to develop methods to assess the completeness and quality of the data going into our maps. Our hope is that with this emphasis on data analysis, we will be able to provide meaningful contributions to a wide array of humanitarian data sets. Additionally, we are hoping to build an analytics team, and will be recruiting data science volunteers in early 2021, so check our website and sign up to our newsletter to find out how you can apply. And if you can contribute in other ways to our data science work, please contact us!

MapAction’s Data Scientist is funded by the German Federal Foreign Office.